
Data.gov catalogs US government data and makes them available on the web; you can find data on a variety of topics such as agriculture, business, climate, education, energy, finance, public safety, and many more. It is a good starting point for finding data if you don’t already know which particular data source to begin your search with; however, it can still be time consuming when it comes to actually downloading the raw data you need. Fortunately, Data.gov also includes APIs from across the government, which can help with obtaining raw datasets. In this post, I share examples of using Data.gov APIs in R to download data from the web. Many APIs are available from the agencies partnering with Data.gov---in this post, I use College Scorecard data from the Department of Education and Alternative Fuel Stations data from the National Renewable Energy Laboratory as examples.
Before running this script, you’ll need to install the httr package if you haven’t done so before. Make sure your machine is connected to the Internet, and then run install.packages("httr"). You only need to do this once.
API key
Get your API key at: https://api.data.gov/signup/. Make sure to plug in your own API key in the following R code.
Working directory and R package
Set the working directory on your computer (the path to where you want R to read/store files), and load the httr package.
# Set working directory
setwd('~/DataApiR') # plug in the working directory on your machine
# Load package
library(httr)
College Scorecard Data API
The College Scorecard project provides information about college costs and outcomes at the individual postsecondary institution level. Reading the documentation of this data will help with understanding how this data set is structured. If you’re interested in using these data, find variables in their Data Documentation. In the following example, I download all available data for Emory University, and then extract variables from the downloaded data.
# plug in your API key
myapikey <- "YOUR API KEY"

# the url path to the service
URL <- "https://api.data.gov/ed/collegescorecard/v1/schools?"

# GET(): download all available data for Emory University
get.data <- GET(URL, query=list(api_key=myapikey,
                                school.name="Emory University",
                                school.city="Atlanta",
                                all_years="true"))

# content(): extract the content from the query
emory.data <- content(get.data)
class(emory.data) # it's a list object
[1] "list"
# what's in emory.data
names(emory.data) # contains two components: metadata, results
[1] "metadata" "results"
# what's inside the results component
names(emory.data$results[[1]])
 [1] "latest"     "2023"       "2022"       "2021"       "2020"       "2019"
 [7] "2018"       "2017"       "2016"       "2015"       "2014"       "2013"
[13] "2012"       "2011"       "2010"       "2009"       "2008"       "2007"
[19] "2006"       "2005"       "2004"       "2003"       "2002"       "2001"
[25] "2000"       "1999"       "1998"       "1997"       "1996"       "school"
[31] "location"   "id"         "ope6_id"    "ope8_id"    "fed_sch_cd"
# see available dev-categories for 2013 data
names(emory.data$results[[1]]$`2013`)
[1] "school"     "student"    "cost"       "aid"        "earnings"   "completion"
[7] "repayment"  "admissions" "academics"
# available variables under the cost category for 2013 data
names(emory.data$results[[1]]$`2013`$cost)
[1] "booksupply"       "tuition"          "roomboard"        "title_iv"
[5] "avg_net_price"    "otherexpense"     "attendance"       "net_price"
[9] "program_reporter"
# elements of the tuition variable
names(emory.data$results[[1]]$`2013`$cost$tuition)
[1] "in_state" "out_of_state" "program_year"
Hopefully you now get the idea of how the data set is structured through seeing the levels of the list. Let’s try to extract variables from the downloaded data. To run the following code, you need to install and load the magrittr package.
# load package
library(magrittr)
# subset list for annual data only

emory.ann <- emory.data$results[[1]][c(as.character(1996:2013))]
names(emory.ann)
[1] "1996" "1997" "1998" "1999" "2000" "2001" "2002" "2003" "2004" "2005"
[11] "2006" "2007" "2008" "2009" "2010" "2011" "2012" "2013"
# extract enrollment of undergraduate degree-seeking students for each year
s.size <- emory.ann %>%
    sapply(function(x) x$student$size) %>%
    unlist()

# extract percentage of first-generation students for each year
s.fg <- emory.ann %>%
    sapply(function(x) x$student$share_firstgeneration) %>%
    unlist()

# combine the two variables into a data frame
emory.s <- data.frame(s.size, s.fg)
# see the first few rows of the data frame
head(emory.s)
     s.size      s.fg
1996   6027 0.1405167
1997   5996 0.1400849
1998   6316 0.1479469
1999   6215 0.1533505
2001   6265 0.1475610
2002   6187 0.1469087
# create a variable of year from the row number
emory.s$year <- rownames(emory.s)

# create a variable s.fg.n: number of first-generation students
emory.s$s.fg.n <- round(emory.s$s.size*emory.s$s.fg)

# save the data as a .csv file
write.csv(emory.s, file="emory.s.csv", row.names = F)
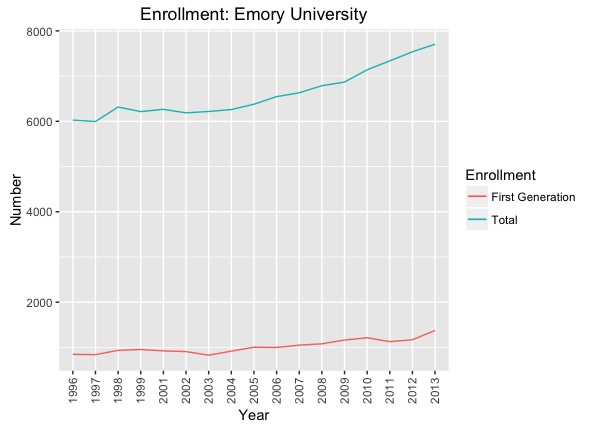
Just to play a bit more with the data we got, we can plot the variables we extracted and created. Install and load the ggplot2 package to run the following code.
# load package
library(ggplot2)

# Line graph of total enrollment and first generation student number
ggplot(emory.s, aes(year)) +
    geom_line(aes(y = s.size, colour = "s.size", group=1)) +
    geom_line(aes(y = s.fg.n, colour = "s.fg.n", group=1)) +
    xlab("Year") + ylab("Number") + # Set axis labels
    ggtitle("Enrollment: Emory University") + # set title
    scale_colour_discrete(name="Enrollment",  # modify legend
                          labels=c("First Generation", "Total")) +
    theme(axis.text.x=element_text(angle=90,hjust=1,vjust=0.5)) # adjust x-axis text position
The R Package for College Scorecard Data API
Many data APIs can be accessed via R packages; College Scorecard is one of them. I find this rscorecard wrapper fairly easy to use for downloading purpose. Check the package’s GitHub page for more details. Here is a simple example of using the package to obtain College Scorecard records that meet the conditions of the query.
library(rscorecard)
sc_key('YOUR API KEY')

# extract Virginia institutions' 2013 data with three variables
df <- sc_init() %>%
    sc_filter(stabbr == 'VA') %>%
    sc_select(unitid, instnm, stabbr) %>%
    sc_year(2013) %>%
    sc_get()

# see first few cases
head(df)
    unitid                                         instnm stabbr year
1   481526               The Chrysm Insitute of Esthetics     VA 2013
2 24893410 ECPI University-Culinary Institute of Virginia     VA 2013
3   475194         Miller-Motte Technical College-Roanoke     VA 2013
4   484765                 University of Phoenix-Virginia     VA 2013
5   459268                 South UniversityVirginia Beach     VA 2013
6 23368402           Strayer University-Woodbridge Campus     VA 2013
Renewable Energy Data API
Let’s use another institution’s data API as an example. The National Renewable Data Laboratory offers APIs for users to access energy data in a few categories. (See its documentation.) In the following example, I query their database of alternative fuel stations in the Transportation category. Again, reading its data documentation should help with data query construction.
# load packages
library(httr)
library(magrittr)
library(ggplot2)

# Get all stations data in Virginia, remember to plug in your own API key
get.afs <- GET("https://developer.nrel.gov/api/alt-fuel-stations/v1.json?api_key=YOUR API KEY&state=VA")

# extract content from the query
afs <- content(get.afs)

# see what's available in the downloaded data
names(afs)
[1] "station_locator_url" "total_results"       "station_counts"
[4] "fuel_stations"
# how many stations in the downloaded data
afs$total_results
[1] 526
# see variables/fields under fuel_stations
names(afs$fuel_stations[[1]])
 [1] "access_days_time"        "cards_accepted"
 [3] "date_last_confirmed"     "expected_date"
 [5] "fuel_type_code"          "id"
 [7] "groups_with_access_code" "open_date"
 [9] "owner_type_code"         "status_code"
[11] "station_name"            "station_phone"
[13] "updated_at"              "geocode_status"
[15] "latitude"                "longitude"
[17] "city"                    "intersection_directions"
[19] "plus4"                   "state"
[21] "street_address"          "zip"
[23] "bd_blends"               "e85_blender_pump"
[25] "ev_connector_types"      "ev_dc_fast_num"
[27] "ev_level1_evse_num"      "ev_level2_evse_num"
[29] "ev_network"              "ev_network_web"
[31] "ev_other_evse"           "hy_status_link"
[33] "lpg_primary"             "ng_fill_type_code"
[35] "ng_psi"                  "ng_vehicle_class"
# extract vars: station_name, fuel_type_code
fsname <- afs$fuel_stations %>%
    sapply(function(x) x$station_name) %>%
    unlist()

ftcode <- afs$fuel_stations %>%
    sapply(function(x) x$fuel_type_code) %>%
    unlist()

# combine the two vars in a data frame
afsdf <- data.frame(fsname, ftcode)

# see the first few rows
head(afsdf)
                             fsname ftcode
1   Virginia Natural Gas - Lance Rd    CNG
2 Virginia Natural Gas - VNG Office    CNG
3                      Dixie Gas Co    LPG
4                            U-Haul    LPG
5                  Suburban Propane    LPG
6                        Revere Gas    LPG
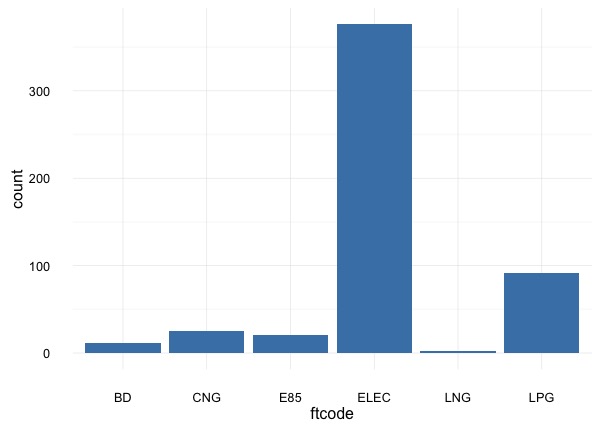
# plot ftcode: type of alternative fuel the station provides
ggplot(afsdf, aes(x=ftcode)) +
    geom_bar(stat="count", fill="steelblue") +
    theme_minimal()
References
- 18F/open-data-maker. (2016). Open data maker HTTP API. Retrieved 20 September, 2016, from https://github.com/18F/open-data-maker/blob/api-docs/API.md
- Boehmke, B. (2016). Scraping via APIs. Retrieved 20 September, 2016, from http://bradleyboehmke.github.io/2016/01/scraping-via-apis.html
Yun Tai
CLIR Postdoctoral Fellow
University of Virginia Library
October 3, 2016
Updated July 14, 2025
For questions or clarifications regarding this article, contact statlab@virginia.edu.
View the entire collection of UVA Library StatLab articles, or learn how to cite.