
"Web scraping," or "data scraping," is simply the process of extracting data from a website. This can, of course, be done manually: You could go to a website, find the relevant data or information, and enter that information into some data file that you have stored locally. But imagine that you want to pull a very large dataset or data from hundreds or thousands of individual URLs. In this case, extracting the data manually sounds overwhelming and time-consuming.
In this article, we'll see how to automate this process with Python using the Beautiful Soup and Selenium libraries. Beautiful Soup is a Python library for extracting and parsing data from HTML files, and the Selenium package is used to automate web browser interaction between Python and your browser, despite differences in browser design (e.g., Chrome versus Firefox).
We'll start by (1) downloading and installing the relevant libraries and web drivers. Next, we'll (2) fetch and render a web page, (3) parse the HTML content, and inspect the web page to figure out what class names and IDs are relevant to the data we want to extract from the HTML. Finally, we'll (4) save the data to a comma-separated variable (CSV) file locally for later use.
At the end of this article, we also demonstrate how the tools built here can be converted to Python functions, automated, and used to scrape data from several hundred different URLs very quickly!
We assume that you have already installed Python, but if not, you can find a detailed set of install instructions here. You'll also need to have either Google Chrome or Firefox installed.
Downloading Libraries
Make sure you install the Beautiful Soup and Selenium libraries in your Python environment. To do so, from your Terminal, run:
pip install beautifulsoup4

pip install selenium
At this point, you also need to install ChromeDriver. You have two options here: You can use Homebrew to install directly from your Terminal (if using macOS), or you can follow the instructions to download a zip file from the ChromeDriver website (Windows or macOS). Using Homebrew, in your Terminal, just run:
brew install --cask chromedriver
This may take a few minutes, but once the install is complete, to check that the install was successful, you can run:
chromedriver --version
The output should match the version of Chrome that you have installed locally (check Chrome > About Google Chrome > Version).
Whether you installed via Homebrew or direct download, we want to confirm that the install was successful and confirm the path to ChromeDriver. In your command line, run:
which chromedriver
Remember this path; we'll need it later.
If using Windows, download the chromedriver_win32.zip file and unzip it. You should have a single exe file called "chromedriver.exe" in a folder called "chromedriver_win32". Again remember the path to this folder and file.
Now we're ready to start web scraping!
Fetching and Rendering a Web Page
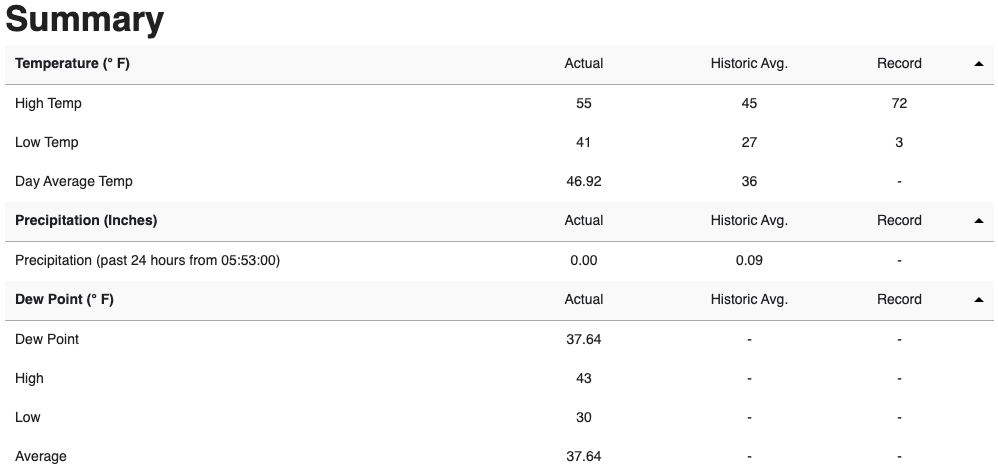
First, let's try rendering a web page without using Selenium and ChromeDriver, and try to parse the HTML. For this demo, we're going to try to scrape the information contained in the Summary table from a Weather Underground page for weather observations taken at the Charlottesville Albemarle Airport (CHO) on December 31, 2020. Here's the URL, https://www.wunderground.com/history/daily/KCHO/date/2020-12-31, and a screenshot of that web page:
Before we try rendering the web page, we want to inspect the HTML elements to determine what class we need to select:
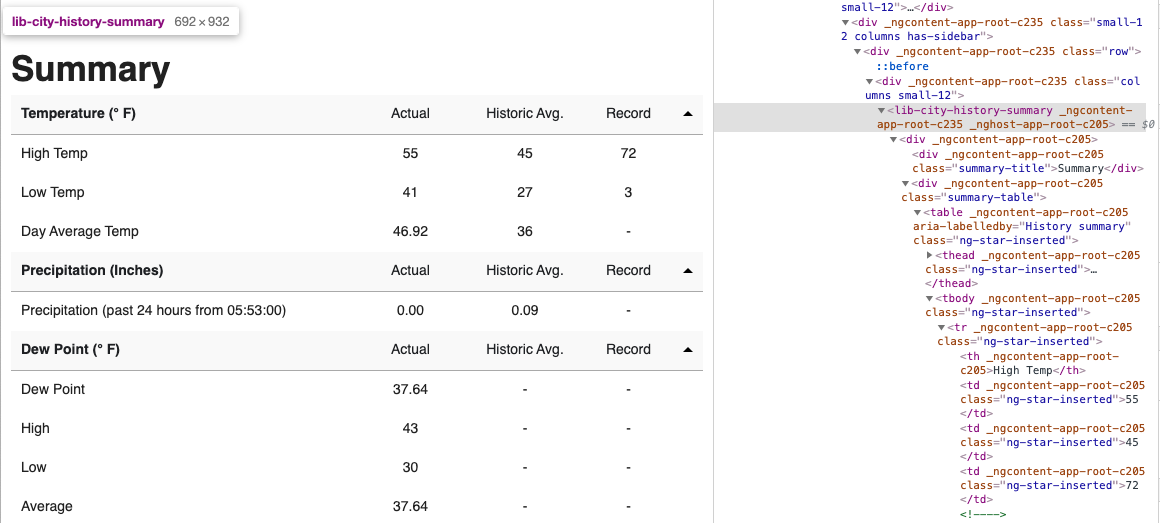
We can see that the entire Summary table is contained under lib-city-history-summary. Let's use that tag to grab just the Summary table elements from the HTML. We'll also use the .prettify() method to print out the selected HTML to make it just a little more readable.
import os

from bs4 import BeautifulSoup
import requests

search_url = 'http://www.wunderground.com/history/daily/KCHO/date/2020-12-31'

wunderground_page = requests.get(search_url)

wunderground_soup = BeautifulSoup(wunderground_page.text, 'html.parser')

soup_container = wunderground_soup.find('lib-city-history-summary')

print(soup_container.prettify())
    <lib-city-history-summary _ngcontent-sc301="" _nghost-sc237="">
     <div _ngcontent-sc237="">
      <div _ngcontent-sc237="" class="summary-title">
       Summary
      </div>
      <div _ngcontent-sc237="" class="summary-table">
       No data recorded
       <!-- -->
       <!-- -->
      </div>
     </div>
    </lib-city-history-summary>
The HTML returned by Beautiful Soup shows "No data recorded," but when we go to the Summary table on the web page, the table is obviously populated. What happened?
In this case, the requests.get() method ran faster than the web page could load, so the Summary table wasn't available by the time Beautiful Soup parsed the web page text. Here's where the Selenium library and ChromeDriver will come in and allow the page content to load completely before we try to parse it.
To do this, we're going to write a quick function, rendering() that will run the ChromeDriver. This will open a Chrome window, load the web page fully, return the page HTML, and quit the ChromeDriver, closing the Chrome window. Be sure to update the path in the webdriver.Chrome() function to the path where you installed the ChromeDriver.
def rendering(url):

        # change '/usr/local/bin/chromedriver' to the path
        # from you got when you ran 'which chromedriver'
        driver = webdriver.Chrome('/usr/local/bin/chromedriver') # run ChromeDriver
        driver.get(url)                                          # load the web page from the URL
        time.sleep(3)                                            # wait for the web page to load
        render = driver.page_source                              # get the page source HTML
        driver.quit()                                            # quit ChromeDriver
        return render                                            # return the page source HTML
Now, using this function, let's try again to get the Summary table elements from the HTML. Following the code written above, where, instead of using requests.get(), we'll use our new rendering function:
import os

from bs4 import BeautifulSoup
from selenium import webdriver

import time

search_url = 'http://www.wunderground.com/history/daily/KCHO/date/2020-12-31'

wunderground_page = rendering(search_url)

wunderground_soup = BeautifulSoup(wunderground_page, 'html.parser')

soup_container = wunderground_soup.find('lib-city-history-summary')

print(soup_container.prettify())
<lib-city-history-summary _ngcontent-app-root-c3284036382="" _nghost-app-root-c145428343="">
 <div _ngcontent-app-root-c145428343="">
  <div _ngcontent-app-root-c145428343="" class="summary-title">
   Summary
  </div>
  <div _ngcontent-app-root-c145428343="" class="summary-table">
   <table _ngcontent-app-root-c145428343="" aria-labelledby="History summary">
    <thead _ngcontent-app-root-c145428343="">
     <tr _ngcontent-app-root-c145428343="">
      <th _ngcontent-app-root-c145428343="">
       Temperature (°F)
      </th>
      <td _ngcontent-app-root-c145428343="">
       Actual
      </td>
      <td _ngcontent-app-root-c145428343="">
       Historic Avg.
      </td>
      <td _ngcontent-app-root-c145428343="">
       Record
      </td>
      <!-- -->
      <td _ngcontent-app-root-c145428343="" style="height: 5px; width: 10px;">
       <svg _ngcontent-app-root-c145428343="" height="5" style="display: block;" width="10">
        <title _ngcontent-app-root-c145428343="">
         Polygon
        </title>
        <polygon _ngcontent-app-root-c145428343="" fill="#000000" points="0,5 5,0 10,5">
        </polygon>
       </svg>
      </td>
     </tr>
    </thead>
    <tbody _ngcontent-app-root-c145428343="">
     <tr _ngcontent-app-root-c145428343="">
      <th _ngcontent-app-root-c145428343="">
       High Temp
      </th>
      <td _ngcontent-app-root-c145428343="">
       55
      </td>
      <td _ngcontent-app-root-c145428343="">
       45
      </td>
      <td _ngcontent-app-root-c145428343="">
       72
...
Parsing the HTML
The returned HTML might look overwhelming (we only show a portion of it), but you can do a quick search for specific keywords in the HTML. For example, we know the table contains parameters of interest: High Temp, Low Temp, etc. Looking through the HTML for these keywords, we find that all of the data—Temperature (° F), Precipitation (Inches), etc.—in the table are contained under tbody, and that each row (e.g., High Temp) is tagged under tr with each data point (e.g., Actual, Historic Avg., and Record) tagged as td.
Saving HTML Data to CSV File
Now let's try rendering that web page, selecting all of the temperature and precipitation data from the Summary table, and then writing that data into a CSV file. For simplicity, we won't pull all of the data from the web page (i.e., we're not interested in Dew Point, Max Wind Speed, Sea Level Pressure (Hg), or Rise/Set times), but the code below can easily be altered to select those values as well if you're interested in that data.
import os

from bs4 import BeautifulSoup
from selenium import webdriver

import time

search_url = 'http://www.wunderground.com/history/daily/KCHO/date/2020-12-31'

outfile = 'KCHO_2020-12-31.csv'

wunderground_page = rendering(search_url)

wunderground_soup = BeautifulSoup(wunderground_page, 'html.parser')

soup_container = wunderground_soup.find('lib-city-history-summary')
soup_data = soup_container.find_all('tbody')

with open(outfile, 'w') as f:
    # write column headers for each parameter into the file for later use
    f.write('date,'
            'actual_high_temp,histavg_high_temp,record_high_temp,'
            'actual_low_temp,histavg_low_temp,record_low_temp,'
            'actual_avg_temp,histavg_avg_temp,record_avg_temp,'
            'actual_precip,histavg_precip,record_precipitation\n')

    row = []
    for i, dat in enumerate(soup_data):
        # loops through High Temp, Low Temp, etc.
        for j, d in enumerate(dat.find_all('tr')):
            # loops through Actual, Historic Avg., Record
            for k in d.find_all('td'):
                tmp = k.text
                tmp = tmp.strip('  ') # remove any extra spaces

                row.append(tmp)

    f.write('2020-12-31,') # write the date of the recorded data into the file
    f.write(','.join(row[:12])) # write just the temperature and precipitation data into the file
    f.write('\n') # new line, in case you want to append more rows to the same file later on
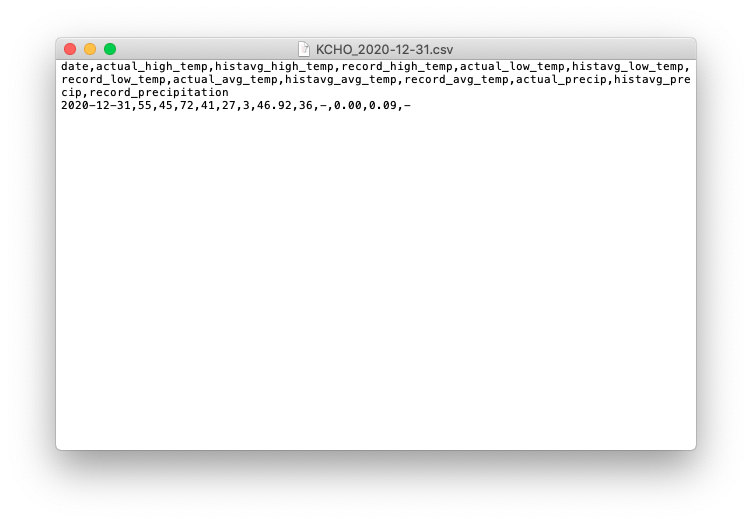
You should now have a single CSV file containing the data from the Summary table from Weather Underground for weather observations taken at CHO on December 31, 2020:
Automating for Scraping Multiple URLs
Let's say we want to scrape the information contained in the Summary table from Weather Underground pages for weather observations taken at any airport for an entire year.
To do this, we need to convert the code above to its own function that can render the web page for any airport (given its corresponding airport code) and loop through multiple web pages for a range of input dates:
def scrape_airport_weather(station, start_date, end_date):

    # make a new directory for each airport that you scrape
    # data for, to keep files separate and organized
    if not os.path.exists(station):
        os.mkdir(station)

    # search URL that can be formatted to find the web page for any airport on any observation date
    search_url = 'http://www.wunderground.com/history/daily/{}/date/{}-{}-{}'

    # csv file name that can be formatted for any airport and any year
    outfile = '{}/{}_{}.csv'.format(station, station, start_date.year)

    # if the csv file does not exist, write, if it does exist, append
    if not os.path.exists(outfile):
        mode = 'w'
    else:
        mode = 'a'

    with open(outfile, mode) as f:
        # write column headers for each paramter into the file for later use
        if mode == 'w':
            f.write('date,actual_high_temp,histavg_high_temp,record_high_temp,'
                    'actual_low_temp,histavg_low_temp,record_low_temp,'
                    'actual_avg_temp,histavg_avg_temp,record_avg_temp,'
                    'actual_precip,histavg_precip,record_precipitation\n')

        # while loop continues until it reaches the given end date
        while start_date != end_date:

            # format the search URL for the given airport and observation date
            format_search_url = search_url.format('K'+station,
                                                  start_date.year,
                                                  start_date.month,
                                                  start_date.day)

            wunderground_page = rendering(format_search_url)

            wunderground_soup = BeautifulSoup(wunderground_page, 'html.parser')
            soup_container = wunderground_soup.find('lib-city-history-summary')
            soup_data = soup_container.find_all('tbody')

            row = []
            for i, dat in enumerate(soup_data):
                # loops through High Temp, Low Temp, etc.
                for j, d in enumerate(dat.find_all('tr')):
                    # loops through Actual, Historic Avg., Record
                    for k in d.find_all('td'):
                        tmp = k.text
                        tmp = tmp.strip('  ') # remove any extra spaces

                        row.append(tmp)

            # write the observation date into the file
            f.write('{}-{}-{},'.format(start_date.year, start_date.month, start_date.day))
            # write just the temperature and precipitation data into the file
            f.write(','.join(row[:12]))
            # new line, in case you want to append more rows to the same file later on
            f.write('\n')

            start_date += timedelta(days=1) # go to next date, i.e., next URL
Now that we have our new scrape_airport_weather() function defined, let's test it!
In this example, we want to scrape data for weather observations taken at the Charlottesville Albemarle Airport (CHO) for all of 2020. To do this, we simply need to define the station, start_date, and end_date parameters and run the function.
import os

from bs4 import BeautifulSoup
from selenium import webdriver

from datetime import datetime, timedelta

station = 'CHO'
start_date = datetime(year=2020, month=1, day=1)
end_date = datetime(year=2021, month=1, day=1)

scrape_airport_weather(station, start_date, end_date)
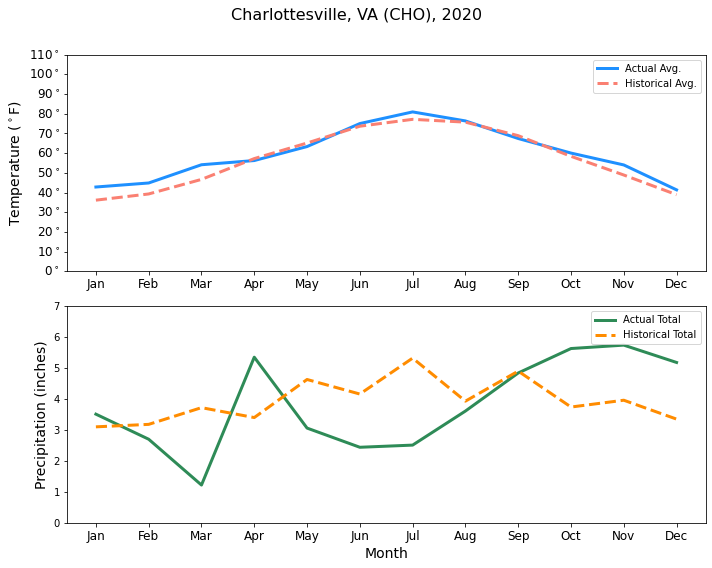
This will take a while to run completely, but you should end up with a CSV file containing 366 dated rows (2020 was a leap year!), each with temperature and precipitation data for that day. You can find a copy of this file at https://static.lib.virginia.edu/statlab/materials/data/CHO_2020.csv.
Now, you can do some fun visualizations with the data! We'll use the pandas package to work with the data here. If you need quick tutorial or a refresher on pandas, check out our Getting Started with pandas in Python article. Note that this is just one example visualization that you can produce with these data; we won't go into detail about working with Weather Underground data here. There are plenty of other interesting analyses that you can do with the long baseline of weather history data provided by Weather Underground!
from datetime import datetime

import matplotlib as mpl
import matplotlib.pyplot as plt
from matplotlib.dates import DateFormatter
import numpy as np
import pandas as pd

df = pd.read_csv('CHO/CHO_2020.csv', # read the data into a pandas dataframe
                 parse_dates=['date'], # parse and index the columns by the date
                 index_col= ['date'])

# these columns are empty, drop them from the dataframe
df = df.drop(['record_avg_temp', 'record_precipitation'], axis=1)

# replace any other empty cells with NaNs
df = df.replace('--',np.nan)

# due to hardware (i.e., weather station) failures, a few
# days have all data set as NaNs, drop these rows
df = df.dropna(subset=['actual_high_temp'])

# handles converting strings containing negative numbers (i.e., '-') to floats
df['record_low_temp'] = pd.to_numeric(df['record_low_temp'], errors='coerce')

# due to hardware (i.e., weather station) failures, a few days have
# Actual Low Temp set to 0, in the middle of summer, replace with NaN
df.loc[df['actual_low_temp'] == 0] = np.nan
# interpolate over NaNs in Actual Low Temp
df['actual_low_temp'] = df['actual_low_temp'].interpolate()

# add month column
df['month'] = df.index.month
# calculate mean, median, and total temperatures and precipitation for each month
month_avg = df.groupby('month').agg(['mean','median','sum'])

fig, ax = plt.subplots(2, 1, figsize=(10, 8))

# first subplot
# plot monthly average Actual Avg Temp and average Historical Avg
ax[0].plot(month_avg.index, month_avg['actual_avg_temp']['mean'], color='dodgerblue', linewidth=3.0, label='Actual Avg.')
ax[0].plot(month_avg.index, month_avg['histavg_avg_temp']['mean'], color='salmon', linewidth=3.0, ls='--', label='Historical Avg.')

# second subplot
# plot monthly total Actual Precipitation and total Historical Avg Precipitation
ax[1].plot(month_avg.index, month_avg['actual_precip']['sum'], color='seagreen', linewidth=3.0, label='Actual Total')
ax[1].plot(month_avg.index, month_avg['histavg_precip']['sum'], color='darkorange', linewidth=3.0, ls='--', label='Historical Total')

# set xtick labels as month names on both subplots
ax[0].set_xticks(range(1, 13, 1))
ax[0].set_xticklabels([datetime(year=2016, month=x, day=1).strftime('%b')
                                     for x in range(1, 13, 1)], fontsize=12)

ax[1].set_xticks(range(1, 13, 1))
ax[1].set_xticklabels([datetime(year=2016, month=x, day=1).strftime('%b')
                                     for x in range(1, 13, 1)], fontsize=12)
# set axis label
ax[1].set_xlabel(r'Month', fontsize=14)

# set ylim and ytick labels on first subplot with degree format
ax[0].set_ylim(10,100)
ax[0].set_yticks(range(0, 111, 10))
ax[0].set_yticklabels([r'{}$^\circ$'.format(x)
                                     for x in range(0, 111, 10)], fontsize=12)
# set axis label
ax[0].set_ylabel(r'Temperature ($^\circ$F)', fontsize=14)

# set ylim and axis label on second subplot
ax[1].set_ylim(0,7)
ax[1].set_ylabel(r'Precipitation (inches)', fontsize=14)

# include legends
ax[0].legend()
ax[1].legend()

# plot title
plt.suptitle('Charlottesville, VA (CHO), 2020\n', fontsize=16)

# formatting for nice saved figure
plt.tight_layout()

# save figure to same directory as csv file
plt.savefig('CHO/CHO_avgtemp_totalprecip.pdf', dpi=300)
Summary
In this article, we've used the Python Beautiful Soup and Selenium libraries to extract and parse data from an example web page. We've also shown how to automate this process for scraping data from many web pages at one time. Now that you understand the basics of web scraping with Python, these functions and methods will hopefully be enough to get you started scraping data from any given website. For more detailed information about the Beautiful Soup and Selenium packages and built-in functions, please see the available documentation.
Python session details
Python version: 3.9.6
beautifulsoup4 version: 4.12.3
selenium version: 4.36
matplotlib version: 3.5.1
pandas version: 1.4.0
numpy version: 1.22.2
Hannah Lewis
StatLab Associate
University of Virginia Library
February 15, 2021
Updated December 17, 2025
For questions or clarifications regarding this article, contact statlab@virginia.edu.
View the entire collection of UVA Library StatLab articles, or learn how to cite.