
When we think of regression, we usually think of linear regression, the tried and true method for estimating a mean of some variable conditional on the levels or values of independent variables. In other words, we’re pretty sure the mean of our variable of interest differs depending on other variables. For example, the mean weight of 1st-year UVA males is some unknown value. But we could in theory take a random sample and discover there is a relationship between weight and height. We may find there is a positive relationship and that the mean weight of males 5’10” is higher than the mean weight of males 5’9”. There is variability in the weights of 1st-year UVA males, and it appears height explains some of that variability.
But we don’t have to always estimate the conditional mean. We could estimate the median, or the 0.25 quantile, or the 0.90 quantile. That’s where quantile regression comes in. The math under the hood is a little different, but the interpretation is basically the same. In the end we have regression coefficients that estimate an independent variable’s predictive effect on a specified quantile of our dependent variable. Using our example above, we could estimate the 0.10 and 0.90 quantile weights for 1st year UVA males given their height. We may find that the relationship between height and weight changes depending on which quantile we look at.
By the way, if you’re wondering if “quantile” is the same as “percentile,” yes, for the most part it is. Quantiles refer to fractions (0.25) while percentiles refer to percents (25%).
Now why use quantile regression? Does it have any benefit beyond estimating quantiles? It does in fact. Let’s provide motivation with an example. Below we generate data with non-constant variance using R and then plot the data using the {ggplot2} package (Wickham 2016). If you don’t have the ggplot2 package, you can installing it by running install.packages("ggplot2").
# generate data with non-constant variance
x <- seq(0, 100, length.out = 100)      # independent variable
sig <- 0.1 + 0.05*x                     # non-constant variance
b_0 <- 6                                # true intercept
b_1 <- 0.1                              # true slope
set.seed(1)                             # make the next line reproducible
e <- rnorm(100, mean = 0, sd = sig)     # normal random error with non-constant variance
y <- b_0 + b_1*x + e                    # dependent variable
dat <- data.frame(x,y)
library(ggplot2)
ggplot(dat, aes(x,y)) + geom_point()

The increasing variability is easy to see. As x gets bigger, y becomes more variable. This violates a key assumption of linear regression: normal errors with constant variance. Our errors are normal, but the variance depends on x. Therefore linear regression in this scenario is of limited value. Yes, the estimated mean conditional on x is unbiased and as good an estimate of the mean as we could hope to get, but it doesn’t tell us much about the relationship between x and y, especially as x gets larger. Plus the confidence interval for predicted mean values is just plain too small. We can quickly visualize this by adding a layer to our original plot. The geom_smooth() function regresses y on x, plots the fitted line and adds a confidence interval:
ggplot(dat, aes(x,y)) +
  geom_point() +
  geom_smooth(method="lm")

If we were to estimate mean values of y when x = 75, with those confidence limits, we would be way too confident! (This is why we plot our data and do regression diagnostics.) One way to deal with non-constant variance is to use something called weighted least squares regression. We won’t cover it in this article, but suffice to say it attempts to address the issues we just raised. Instead we present quantile regression.
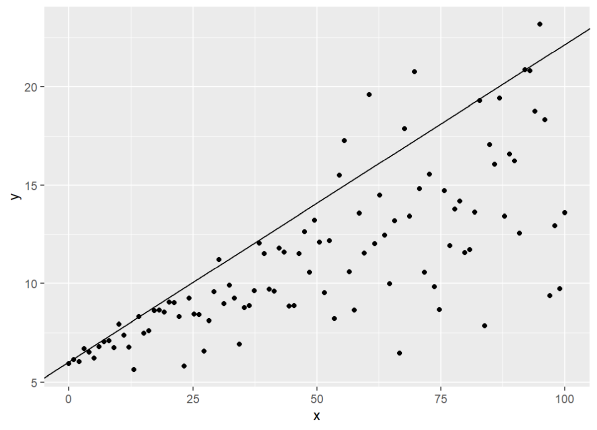
Looking again at the plot above, we see that linear regression provides a good estimate of y when x is close to 0. But as x increases, the mean of y given x becomes less meaningful. As a predictor of y it’s pretty useless. But what about a quantile, like the 0.90 quantile? We can quickly visualize this using ggplot2 with the geom_quantile() function:
ggplot(dat, aes(x,y)) +
  geom_point() +
  geom_quantile(quantiles = 0.9)

Behind the scenes {ggplot2} ran a quantile regression for the 0.90 quantile and then plotted the fitted line. We see the scatter about the plotted line is relatively uniform. It appears we can make decent estimates of the 0.90 quantile for increasing values of x despite the increasing variability.
To perform quantile regression in R, we recommend the {quantreg} package (Koenker 2005). You can install it by running install.packages("quantreg"). Here’s how we perform the quantile regression that {ggplot2} did for us using the {quantreg} function rq():
library(quantreg)
qr1 <- rq(y ~ x, data=dat, tau = 0.9)
This is identical to the way we perform linear regression with the lm() function in R except we have an extra argument called “tau” that we use to specify the quantile. (The default tau setting is 0.5, the median.) We can use the summary() function to extract details about the model.
summary(qr1)
Call: rq(formula = y ~ x, tau = 0.9, data = dat)
tau: [1] 0.9
Coefficients:
            coefficients lower bd upper bd
(Intercept) 6.04168      5.93265  6.39328
x           0.16125      0.15591  0.17826
The “lower bd” and “upper bd” values are confidence intervals calculated using the “rank” method. To read about the rank method and the four other methods available, enter ?summary.rq in the R console. The x coefficient estimate of 0.16 says the 0.90 quantile of y increases by about 0.16 for every one-unit increase in x.
Using the coef() function in combination with the geom_abline() function, we can recreate what we got with geom_quantile() and ensure our results match:
ggplot(dat, aes(x,y)) +
  geom_point() +
  geom_abline(intercept=coef(qr1)[1], slope=coef(qr1)[2])
The rq() function can perform regression for more than one quantile. Simply pass a vector of quantiles to the tau argument. Here’s how to perform quantile regression for the 0.10, 0.20, …, 0.90 quantiles:
qs <- 1:9/10
qr2 <- rq(y ~ x, data=dat, tau = qs)
Calling the summary() function on qr2 will return 9 different summaries. We won’t show this here but we will show the coef() function:
coef(qr2)
              tau= 0.1   tau= 0.2   tau= 0.3   tau= 0.4  tau= 0.5  tau= 0.6
(Intercept) 5.95735740 5.93735462 6.19112214 6.08146314 6.0240983 6.1684082
x           0.03796304 0.06942669 0.07394535 0.09208019 0.1035056 0.1150738
             tau= 0.7  tau= 0.8 tau= 0.9
(Intercept) 6.0950777 6.1053934 6.041681
x           0.1278356 0.1378255 0.161254
The intercept estimate doesn’t change much, but the slopes steadily increase. We can visualize this easily using geom_quantile():
ggplot(dat, aes(x,y)) +
  geom_point() +
  geom_quantile(quantiles = qs)

The {quantreg} package includes a plot() method to visualize the change in quantile coefficients along with confidence intervals. We use the “parm” argument to indicate we only want to see the slope coefficients.
plot(summary(qr2), parm="x")
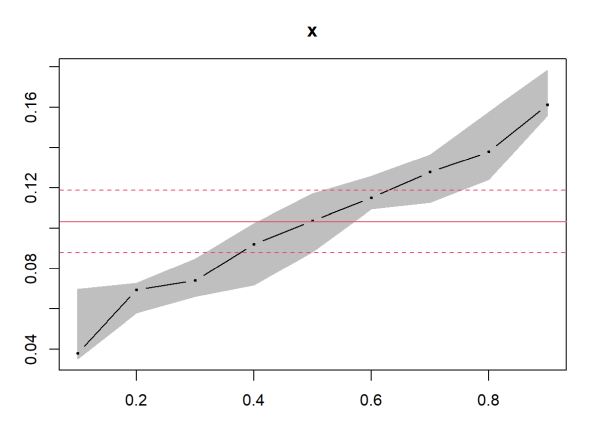
Each black dot is the slope coefficient for the quantile indicated on the x axis. The red lines are the least squares estimate and its confidence interval. You can see how the lower and upper quartiles are well beyond the least squares estimate. What happens if we generate data with normal errors and constant variance and then try quantile regression? Let’s see:
x <- seq(0,100,length.out = 100)
b_0 <- 6
b_1 <- 0.1
set.seed(1)
e <- rnorm(100,mean = 0, sd = 0.5)
y <- b_0 + b_1*x + e
dat2 <- data.frame(x,y)
qr3 <- rq(y ~ x, data=dat2, tau = qs)
plot(summary(qr3), parm="x")

It appears the linear regression slope is sufficient to describe the relationship between x and y. The quantile slope estimates are not statistically different from the least squares estimate.
If you’re a Stata user, check out the qreg function for performing quantile regression. There’s also a user-contributed Stata package called grqreg that creates graphs similar to R’s {quantreg} plotting method.
There’s much more to say about quantile regression such as how the coefficients are estimated, the various standard errors, comparing models, nonlinear quantile regression, and so on. But hopefully this primer will be enough to get you started. For another introduction to quantile regression see Cade and Noon (2003).
R session details
The analysis was done using the R Statistical language (v4.5.1; R Core Team, 2025) on Windows 11 x64, using the packages SparseM (v1.84.2), quantreg (v6.1) and ggplot2 (v3.5.2).
References
- Cade BS and Noon BR (2003). A gentle introduction to quantile regression for ecologists. Frontiers in Ecology and the Environment, 1: 412-420. https://doi.org/10.1890/1540-9295(2003)001[0412:AGITQR]2.0.CO;2.
- Koenker R (2025). quantreg: Quantile Regression. https://doi.org/10.32614/CRAN.package.quantreg, R package version 6.1, https://CRAN.R-project.org/package=quantreg.
- R Core Team (2025). R: A Language and Environment for Statistical Computing. R Foundation for Statistical Computing, Vienna, Austria. https://www.R-project.org/.
- Wickham H. (2016). ggplot2: Elegant Graphics for Data Analysis. Springer-Verlag New York.
Clay Ford
Statistical Research Consultant
University of Virginia Library
September 20, 2015
For questions or clarifications regarding this article, contact statlab@virginia.edu.
View the entire collection of UVA Library StatLab articles, or learn how to cite.