
Note: This article demonstrates how to use propensity scores for matching data. However, propensity scores have come under fire in recent years. In their 2019 article, Why Propensity Scores Should Not Be Used for Matching, King and Nielsen argue that propensity scores increase imbalance, inefficiency, model dependence, and bias. Others argue that while propensity scores may be sub-optimal, they can be useful in certain situations. As with all statistical analyses, proceed with caution, accept uncertainty, and be thoughtful, open and modest.
A frequent research question is whether or not some "treatment" causes an effect. For example, does taking aspirin daily reduce the chance of a heart attack? Does more sleep lead to better academic performance for teenagers? Does smoking increase the risk of chronic obstructive pulmonary disease (COPD)? To truly answer such questions, we need a time machine and a lack of ethics. We would need to be able to take a subject and, say, make him or her smoke for several years and observe whether or not they get COPD. Then travel back in time and observe the same subject NOT smoking to see if they get COPD. Only then could we really see the effect of smoking on that person's chances of contracting COPD. To estimate the average effect of smoking on COPD, we would need to do the same with many subjects. Clearly the laws of physics and all IRBs forbid this. To work around these issues researchers often employ what are called "matching methods". This involves taking observational data, such as data from surveys, and matching people who have similar characteristics but different treatments. I can't travel through time and make a person smoke and not smoke. But I can identify two people who are similar in almost every way except their smoking status. Here's a 200-pound, middle class, college educated, Caucasian man who smokes, and a 200-pound, middle class, college educated, Caucasian man who does NOT smoke. They're not the same people but they're similar. It stands to reason the effects of smoking on the smoker can approximate the effect of smoking on the non-smoker, and vice versa. This is the idea of matching methods: create two such groups that are similar in every respect but their treatment. For a fantastic and easy-to-read overview of matching methods, see Elizabeth Stuart's 2010 paper "Matching Methods for Causal Inference: A Review and a Look Forward". See also Michele Claibourn's excellent 2014 workshop on matching methods. In this brief article, we demonstrate how to get started with matching methods using R and the MatchIt package. To begin we need to load some data. For demonstration purposes we'll use a sample of the 2015 BRFSS survey (pronounced bur-fiss). BRFSS stands for Behavioral Risk Factor Surveillance System. BRFSS is a CDC telephone survey that collects state data about U.S. residents regarding their health-related risk behaviors and chronic health conditions. The entire survey has over 400,000 records and over 300 variables. The sample we'll work with has 5000 records and 7 variables.
brfss <- read.csv("http://static.lib.virginia.edu/statlab/materials/data/brfss_2015_sample.csv",
                     stringsAsFactors = TRUE)
summary(brfss)
  COPD          SMOKE              RACE         AGE           SEX           WTLBS        AVEDRNK2
 No :4707   Min.   :0.0000   Black   : 308   18-24: 258   Female:2521   Min.   : 85   Min.   : 1.000
 Yes: 293   1st Qu.:0.0000   Hispanic: 339   25-34: 599   Male  :2479   1st Qu.:148   1st Qu.: 1.000
            Median :0.0000   Other   : 254   35-44: 667                 Median :172   Median : 2.000
            Mean   :0.1524   White   :4099   45-54: 914                 Mean   :178   Mean   : 2.122
            3rd Qu.:0.0000                   55-64:1122                 3rd Qu.:200   3rd Qu.: 2.000
            Max.   :1.0000                   65+  :1440                 Max.   :527   Max.   :30.000
The summary provides details on the seven variables:
- COPD: Ever told you have chronic obstructive pulmonary disease (COPD)?
- SMOKE: Adults who are current smokers (0 = no, 1 = yes)
- RACE: Race group
- AGE: age group
- SEX: gender
- WTLBS: weight in lbs
- AVEDRNK2: During the past 30 days, when you drank, how many drinks did you drink on average?
We wish to investigate the effect of smoking on COPD. Does smoking increase the chance of contracting COPD? Obviously this is not something we could carry out as a randomized experiment. But perhaps using this observational data and matching methods we can simulate what our data might look like had we carried out a randomized experiment. We can create two groups, smokers and non-smokers, who are roughly equivalent in age, race, sex, weight and alcohol consumption. (Please note this is only for educational purposes. While the data is real and the methods are sound, we would certainly include several other variables as well as enlist the help of doctors and epidemiologists to investigate a research question like this.) Before we start matching, let's check the balance and overlap of our data. By balance we mean that the distributions of our data in the smoking and non-smoking groups are similar. By overlap, we mean that the continuous variables in the smoking and non-smoking groups span the same range of values. We can informally check both with some plots. Notice below we use the factor() function to ensure ggplot recognizes smoking as a categorical variable. We have smoking stored in our data as a numeric column of zeroes and ones because that's how the MatchIt package requires treatment variables to be stored.
library(ggplot2)
p <- ggplot(brfss, aes(fill = factor(SMOKE))) +
  geom_bar(position = "dodge") +
  scale_fill_discrete("Smoke")
p + aes(x = AGE)
p + aes(x = RACE)
p + aes(x = SEX)
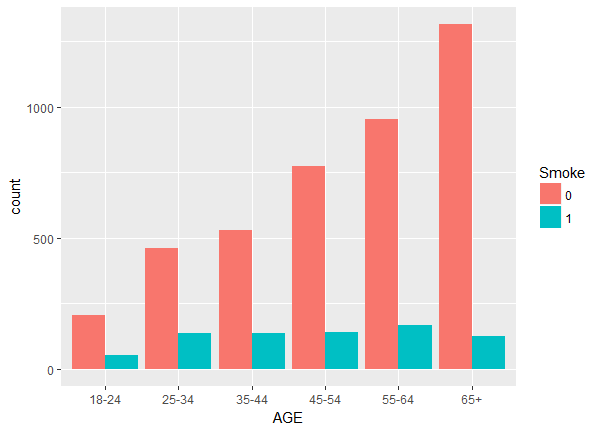
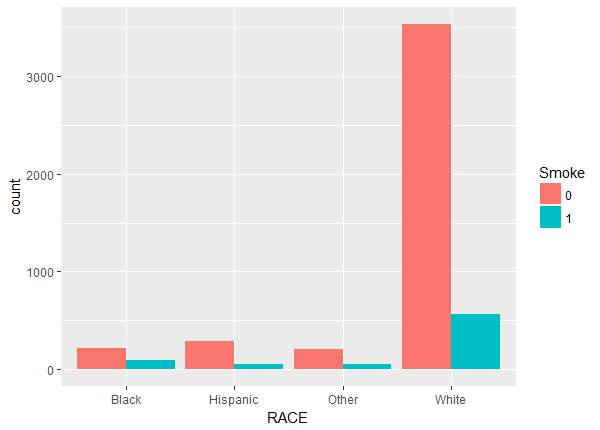
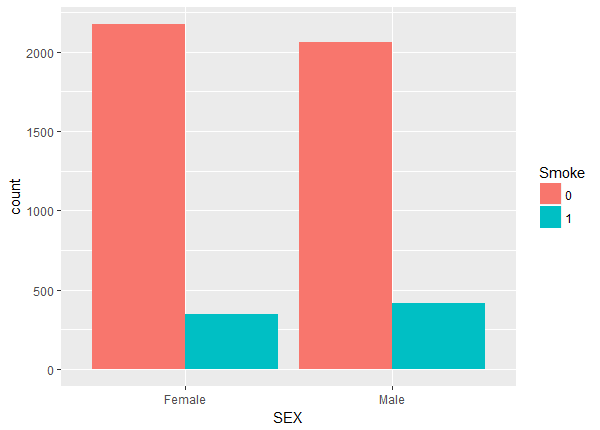
Above we notice a lack of balance. For example, the number of non-smokers increase with age while the number of smokers stays fairly constant. To check the balance and overlap of the continuous weight and drink variables we plot histograms.
ggplot(brfss, aes(x = WTLBS, fill = factor(SMOKE))) +
  geom_histogram(position = "identity") +
  scale_fill_discrete("Smoke")

ggplot(brfss, aes(x = AVEDRNK2, fill = factor(SMOKE))) +
  geom_histogram(position = "identity", binwidth = 1) +
  scale_fill_discrete("Smoke")
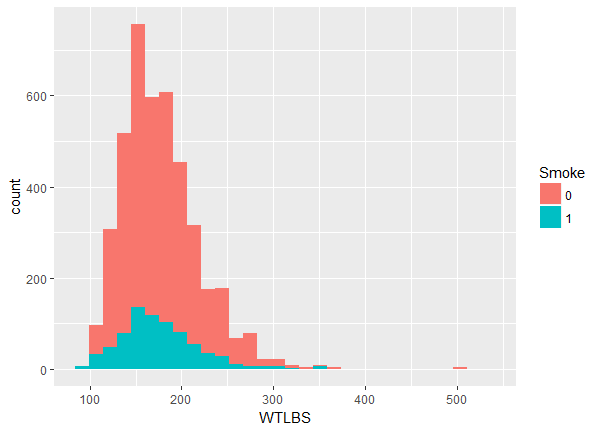
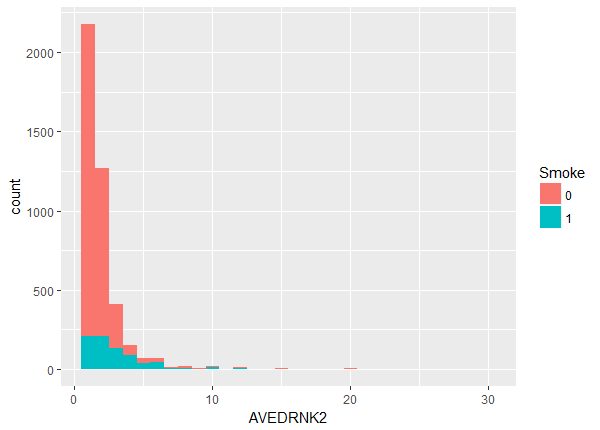
The balance maybe looks OK but there appears to be a slight lack of overlap at the higher values. We can investigate more closely by looking at the quantiles within each group.
tapply(brfss$WTLBS, brfss$SMOKE, quantile, probs = seq(0.2, 1, 0.1))
$`0`
 20%  30%  40%  50%  60%  70%  80%  90% 100%
 140  150  163  175  185  200  212  240  522

$`1`
  20%   30%   40%   50%   60%   70%   80%   90%  100%
140.0 150.0 160.0 172.5 180.0 195.0 209.8 235.0 506.0
tapply(brfss$AVEDRNK2, brfss$SMOKE, quantile, probs = seq(0.2, 1, 0.1))
$`0`
 20%  30%  40%  50%  60%  70%  80%  90% 100%
   1    1    1    1    2    2    2    3   30

$`1`
 20%  30%  40%  50%  60%  70%  80%  90% 100%
   1    2    2    2    3    3    4    6   30
We see that once we get past the 30th quantile the non-smokers begin to outweigh the smokers, and the smokers begin to outdrink the non-smokers, producing a lack of balance. On the other hand, it seems the lack of overlap isn't as bad as we thought. At this point we're ready to proceed to matching. The idea of matching isn't complicated. We want to simply find subjects with matching covariates among the smokers and non-smokers. However it's often difficult to find exact matches, so instead we define a "closeness" or "distance" metric and use that to generate matches. In this tutorial we'll use Nearest Neighbor Matching which is the default method in the MatchIt package. Nearest Neighbor Matching selects the best control (non-smoker) for each treated subject (smoker) using a distance measure called the propensity score. The end result is two groups of equal size and (hopefully) similar distributions of covariates. The propensity score is the estimated probability of receiving treatment (ie, being a smoker), conditional on the covariates. If two subjects, one who is a smoker and the other who is not, have similar propensity scores, then we think of them as potential matches. To carry out Nearest Neighbor Matching we load the MatchIt package and use the matchit() function. Notice we need to assign the result of the matchit() function to an object. Below we name it "m.out", but you can name it something else if you like. matchit() uses R's formula syntax to define what we want to match on. On the left side of the tilde (~) is SMOKE. That's our treatment variable. On the right side of the tilde are the variables we want to match on. We have kept it simple but you can match on interactions and higher powers. Also notice we have not included our dependent variable, COPD! That is by design. At this step we are trying to create balance across covariates among smokers and non-smokers. The analysis of COPD comes after the matching procedure.
install.packages("MatchIt")
library(MatchIt)
m.out <- matchit(SMOKE ~ RACE + AGE + SEX + WTLBS + AVEDRNK2, data = brfss)
That should run fairly quickly on just about any computer. The next step is to investigate the results of the matching procedure. Did we improve balance? Are the smokers and non-smokers similar across age, race, weight, number of drinks and sex? The quickest way to check this is to plot a summary of the results, like so:
s.out <- summary(m.out, standardize = TRUE)
plot(s.out)
First we call summary() on m.out and save to a new object called "s.out". For the plot to work we need to also set the standardize argument to TRUE. Then we call plot() on the s.out object. The result is a Love Plot.
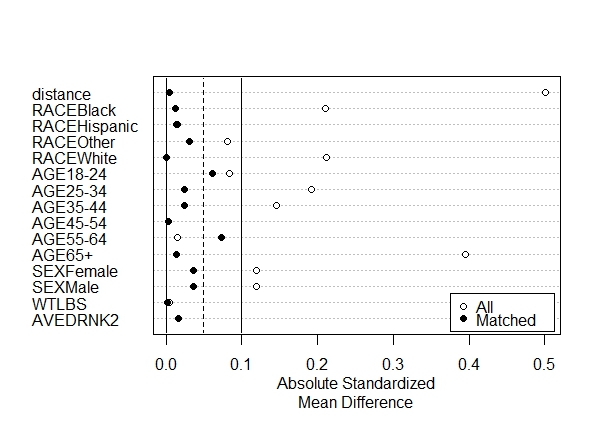
On the y-axis we have our variables. On the x-axis we have absolute standardized mean difference between control and treated groups for all data (open dots) and the matched data (black dots). The further the dots are from 0, the more lack of balance we have between our control and treated groups. We see prior to matching, there were large differences for the Age 65+ groups and the distance measure (i.e., the propensity score). But after matching, the differences are well under 0.1. As a general rule, we would like to see all differences for the matched data to be less than 0.1, which is what we have. In one case, for the Age 55-64 group, we see balance actually get worse. This is common when you match on covariates that were already pretty well balanced to begin with. Since the standardized mean difference is still less than 0.1, we're not too concerned about it.
We can also compare the distribution of propensity scores (distance) before and after matching.
plot(m.out,  type = "jitter", interactive = FALSE)
plot(m.out,  type = "hist")
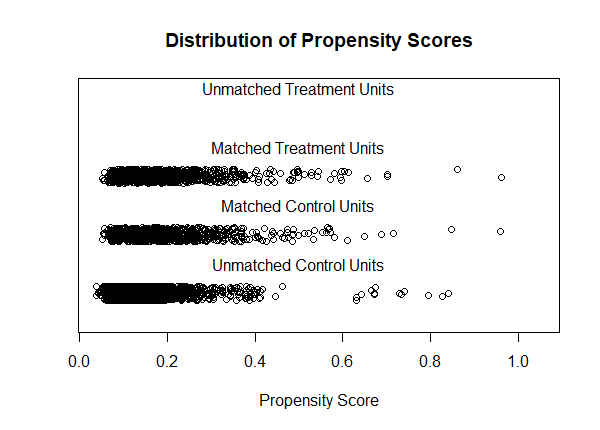
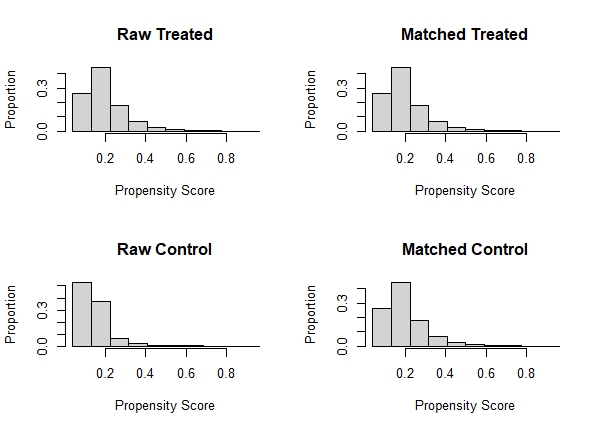
What we want to see is that the Matched Treated (smokers) and Matched Control (non-smokers) distributions are roughly similar. We like what we see here. We can also evaluate the matching results using tabular output. Just call summary() on the "m.out" object. Below is the results of our matching procedure.
summary(m.out)
Call:
matchit(formula = SMOKE ~ RACE + AGE + SEX + WTLBS + AVEDRNK2,
    data = brfss)

Summary of Balance for All Data:
             Means Treated Means Control Std. Mean Diff. Var. Ratio eCDF Mean eCDF Max
distance            0.1991        0.1440          0.5010     1.8920    0.1879   0.2770
RACEBlack           0.1194        0.0512          0.2104          .    0.0682   0.0682
RACEHispanic        0.0709        0.0672          0.0141          .    0.0036   0.0036
RACEOther           0.0682        0.0477          0.0816          .    0.0206   0.0206
RACEWhite           0.7415        0.8339         -0.2111          .    0.0924   0.0924
AGE18-24            0.0696        0.0484          0.0833          .    0.0212   0.0212
AGE25-34            0.1824        0.1085          0.1913          .    0.0739   0.0739
AGE35-44            0.1811        0.1248          0.1461          .    0.0563   0.0563
AGE45-54            0.1837        0.1826          0.0028          .    0.0011   0.0011
AGE55-64            0.2192        0.2253         -0.0149          .    0.0062   0.0062
AGE65+              0.1640        0.3103         -0.3949          .    0.1462   0.1462
SEXFemale           0.4541        0.5132         -0.1188          .    0.0591   0.0591
SEXMale             0.5459        0.4868          0.1188          .    0.0591   0.0591
WTLBS             177.7561      177.9875         -0.0050     1.1223    0.0078   0.0259
AVEDRNK2            2.9843        1.9672          0.4063     1.9119    0.0529   0.2649

Summary of Balance for Matched Data:
             Means Treated Means Control Std. Mean Diff. Var. Ratio eCDF Mean eCDF Max Std. Pair Dist.
distance            0.1991        0.1986          0.0041     1.0234    0.0004   0.0079          0.0055
RACEBlack           0.1194        0.1155          0.0121          .    0.0039   0.0039          0.4330
RACEHispanic        0.0709        0.0669          0.0153          .    0.0039   0.0039          0.3938
RACEOther           0.0682        0.0761         -0.0312          .    0.0079   0.0079          0.4684
RACEWhite           0.7415        0.7415          0.0000          .    0.0000   0.0000          0.2520
AGE18-24            0.0696        0.0853         -0.0619          .    0.0157   0.0157          0.5262
AGE25-34            0.1824        0.1916         -0.0238          .    0.0092   0.0092          0.5267
AGE35-44            0.1811        0.1903         -0.0239          .    0.0092   0.0092          0.4941
AGE45-54            0.1837        0.1850         -0.0034          .    0.0013   0.0013          0.4033
AGE55-64            0.2192        0.1890          0.0730          .    0.0302   0.0302          0.3965
AGE65+              0.1640        0.1588          0.0142          .    0.0052   0.0052          0.1914
SEXFemale           0.4541        0.4724         -0.0369          .    0.0184   0.0184          0.6695
SEXMale             0.5459        0.5276          0.0369          .    0.0184   0.0184          0.6695
WTLBS             177.7561      177.8207         -0.0014     1.1973    0.0099   0.0315          0.6656
AVEDRNK2            2.9843        2.9423          0.0168     0.8227    0.0143   0.0722          0.4415

Sample Sizes:
          Control Treated
All          4238     762
Matched       762     762
Unmatched    3476       0
Discarded       0       0
The first two sections look at all the data and the matched data, respectively. The first three columns are probably the easiest to examine. The first and second columns show the means for treated (smokers) and control (non-smokers) groups. Prior to matching, for example, we have 16% of smokers over age 65 versus 31% who are not smokers. That's a standardized mean difference of about -0.39. After matching we have roughly an equal proportion of subjects over age 65 in both groups with a negligible mean difference. The “Var. Ratio” column reports ratios of the treatment group variances. We would like to see these close to 1. The “Pair Dist.” Column reports the average of the absolute differences between pairs. The columns labeled eCDF refer to empirical cumulative distribution functions. They provide the mean and maximum distance between the empirical CDF functions of the treated and control groups. Values greater than 0 indicate deviations between the groups in some part of the empirical distributions. These are most useful for continuous variables. The last section tells us we now have equal numbers (762) in both the treated and control groups.
We can view plots of the empirical CDFs by calling plot() on the matching object. The which.xs argument allows us to specify which variables to plot. Below we plot weight and number of drinks.
plot(m.out, which.xs = c("WTLBS", "AVEDRNK2"))
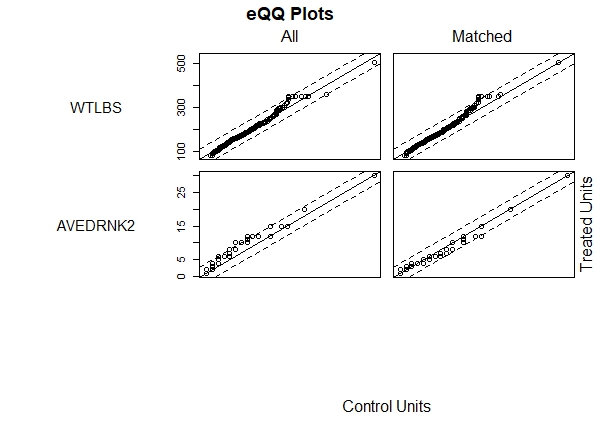
We hope to see the points in the right column (Matched) falling between the dotted lines. The idea is that if both groups, smokers and non-smokers, have good balance then the quantiles should lie on a 45-degree line. Once again we like what we see. When we're satisfied with the results of the matching procedure, the next step is to create a new data frame that contains only the matched data. For this we use the match.data() function on the matching object. Below we create a new data frame called brfss.match.
brfss.match <- match.data(m.out)
And now we're ready to perform our statistical analysis as if our data had been generated through randomization. For instance, we might perform logistic regression to analyze how smoking affects the probability of contracting COPD.
brfss.match$SMOKE <- factor(brfss.match$SMOKE, labels = c("No", "Yes"))
mod <- glm(COPD ~ SMOKE + AGE + RACE + SEX + WTLBS + AVEDRNK2,
           data = brfss.match, family = "binomial")
exp(confint(mod, parm = "SMOKEYes"))
   2.5 %   97.5 %
2.868077 7.091090
It appears that smokers are at least 2.9 times more likely to report COPD than non-smokers, controlling for age, sex, race, weight and drinking. We should note that since we did 1:1 matching without replacement (i.e., Nearest Neighbor Matching), we can run the analysis without using the weights argument in glm(). Most other matching methods will produce matching weights that will need to be used in the analysis via the weights argument.
There is much more to learn about matching methods. The MatchIt web site provides a nice overview of how to implement various matching methods. It's worth pointing out that matching does not necessarily guarantee that each treated subject will have a matching control that has identical covariate values. The only guarantee is that groups of individuals with similar distance measures (eg, propensity scores) will have similar covariate distributions. Having said that, it is possible to see which control subject was matched with which treated subject. The matching object has a match.matrix component, where the row names correspond to the names of the treated, and the cells correspond to the names of the matched controls. Here are the first few matches in our m.out match.matrix:
head(m.out$match.matrix)
   1
29 "3128"
44 "3957"
62 "4669"
81 "1970"
82 "2849"
87 "4754"
So row 29 of brfss was a treated subject (a smoker) matched to the control subject in row 3128 (a non-smoker). If we compare them we notice they don't exactly match up:
brfss[29,]
   COPD SMOKE     RACE   AGE  SEX WTLBS AVEDRNK2
29   No     1 Hispanic 25-34 Male   150       10
brfss[3128,]
     COPD SMOKE  RACE   AGE  SEX WTLBS AVEDRNK2
3128   No     0 Other 25-34 Male   164        8
The most glaring difference is RACE. But recall, they weren't matched on the specific covariates but rather their propensity score. We can compare their propensity scores as follows (taking advantage of the fact that the row names in the matched data frame are the same as those in the original data frame):
i <- rownames(brfss.match) %in% c(29,3128)
brfss.match[i,]
     COPD SMOKE     RACE   AGE  SEX WTLBS AVEDRNK2  distance weights
29     No   Yes Hispanic 25-34 Male   150       10 0.4776235       1
3128   No    No    Other 25-34 Male   164        8 0.4634368       1
The propensity score is in the distance column. According to the propensity score, these subjects are similar. Matching on this distance metric helps ensure the smoking and non-smoking groups have similar covariate distributions. So even though these two specific subjects do not match on RACE, overall the smoking and non-smoking groups are balanced on RACE. We mentioned earlier that the propensity score is the probability of receiving treatment (ie, being a smoker), conditional on the covariates. The matchit() function calculates this for us but we can do it as well by performing a logistic regression of SMOKE on the covariates that we want to balance on. Notice the formula is identical to the one we used with matchit().
pscore <- glm(SMOKE ~ RACE + AGE + SEX + WTLBS + AVEDRNK2,
              data = brfss, family = binomial)
Here are the first 6 propensity scores in the brfss.match data frame (again, the row numbers correspond to the rows in our original brfss data frame):
head(brfss.match[, "distance", drop = F])
     distance
1  0.19127152
3  0.08129118
13 0.10868555
14 0.41062392
21 0.07483546
22 0.32779268
We get the same results by using our model to make predictions for the same subjects:
predict(pscore, type = "response")[c(1,3,13,14,21,22)]
         1          3         13         14         21         22
0.19127152 0.08129118 0.10868555 0.41062392 0.07483546 0.32779268
Another type of distance measure is the linear propensity score. It's just the log-odds version of the propensity score. Whereas the probability-based propensity score is bounded from 0 to 1, the linear propensity score has no such bounds. This means we can make better matches in the lower and upper extremes of the scores since the values are not being compressed near 0 or 1. In section 6.2 of her paper, Stuart actually recommends using the linear propensity score. Fortunately MatchIt makes it easy to do. Simply set the distance argument to “glm” and the link argument to “linear.logit”:
m.out.lp <- matchit(SMOKE ~ RACE + AGE + SEX + WTLBS + AVEDRNK2,
                    data = brfss,
                    distance = "glm",
                    link = "linear.logit")
The resulting propensity scores are on the log-odds scale, which we can verify as we did before:
brfss.match2 <- match.data(m.out.lp)
head(brfss.match2[, "distance", drop = F])
     distance
1  -1.4417693
2  -2.0709984
14 -0.3613867
21 -2.5146797
22 -0.7181855
25 -1.9113250
predict(pscore)[c(1,2,14,21,22, 25)] # default prediction is on log-odds scale
         1          2         14         21         22         25
-1.4417693 -2.0709984 -0.3613867 -2.5146797 -0.7181855 -1.9113250
Notice that matching on the linear propensity score has resulted in different subjects being selected. We leave it as an exercise for the interested reader to verify that the improvement in balance is essentially the same as the matching performed on the probability-based propensity score.
R session details
The analysis was done using the R Statistical language (v4.5.2; R Core Team, 2025) on Windows 11 x64, using the packages MatchIt (v4.7.2) and ggplot2 (v4.0.1).
References
- Claibourn, M. (2014). Matching Methods for Causal Inference. Workshop presented at the UVA Library. http://static.lib.virginia.edu/statlab/materials/workshops/MatchingMethods.zip
- Gelman, A. and Hill, J. (2007). Data Analysis Using Regression and Multilevel/Hierarchical Models. Cambridge. Chapters 9 and 10.
- Ho, D., Imai K., King, G., Stuart, E. (2011). MatchIt: Nonparametric Preprocessing for Parametric Causal Inference. Journal of Statistical Software, Vol. 42, No. 8, pp. 1-28. URL http://www.jstatsoft.org/v42/i08/
- R Core Team (2018). R: A Language and Environment for Statistical Computing. R Foundation for Statistical Computing, Vienna, Austria. https://www.R-project.org/.
- Stuart, E. (2010). Matching Methods for Causal Inference: A Review and a Look Forward. Statistical Science. Vol. 25, No. 1, 1–21. DOI: 10.1214/09-STS313
- Centers for Disease Control and Prevention (CDC). Behavioral Risk Factor Surveillance System Survey Questionnaire. Atlanta, Georgia: U.S. Department of Health and Human Services, Centers for Disease Control and Prevention, 2015.
Clay Ford
Statistical Research Consultant
University of Virginia Library
April 24, 2018
Edited November 8, 2024 to reflect changes to the MatchIt package
For questions or clarifications regarding this article, contact statlab@virginia.edu.
View the entire collection of UVA Library StatLab articles, or learn how to cite.