
In this article, we plan to get you up and running with gamma regression. But before we dive into that, let’s review the familiar normal distribution. This will provide some scaffolding to help us transition to the gamma distribution.
As you probably know, a normal distribution is described by its mean and standard deviation. These are called parameters. The mean is the peak of the distribution. The standard deviation describes the width of the distribution and is the inflection point where the curve changes from concave-down to concave-up. We can think of these parameters as tuning knobs which change the shape of the distribution.
Below is a simple plot of a normal distribution with mean 2 and standard deviation 1.2 created using R. We draw the plot with the curve() function. The dnorm() function is basically the formula for the normal distribution. We run x values ranging from -2 to 6 through dnorm() and plot the line. We also label the mean and standard deviation. The standard deviation is the distance from the mean to the inflection point.
curve(dnorm(x, mean = 2, sd = 1.2), from = -2, to = 6,
      ylab = "",
      main = "Normal distribution with mean = 2 and sd = 1.2")
points(x = c(2 - 1.2, 2, 2 + 1.2),
       y = dnorm(c(2 - 1.2, 2, 2 + 1.2), mean = 2, sd = 1.2),
       col = c(2, 1, 2), pch = 19)
legend("topright", c("mean", "sd"), col = c(1, 2), pch = 19)
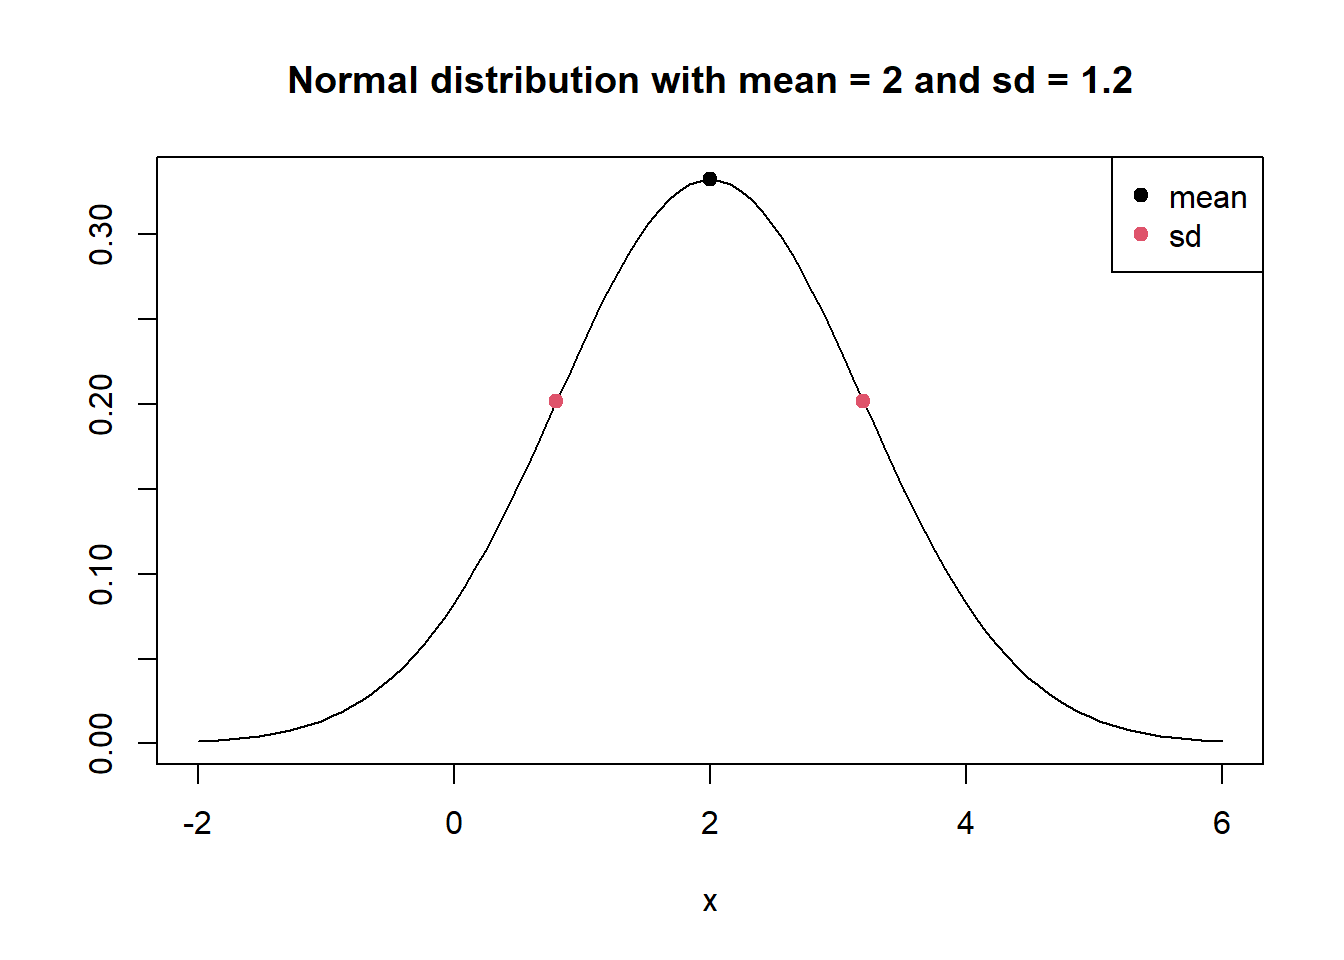
The take-home message of this plot: If you know the mean and standard deviation of a normal distribution, it’s quite easy to sketch or visualize.
Next we use the rnorm() function in R to sample 1000 data points from a theoretical normal distribution with a mean of 2 and a standard deviation of 1.2. Using set.seed(99) allows you to sample the same data. Notice the sample mean and standard deviation are close to the “true” values used in the rnorm() function.
set.seed(99)
y <- rnorm(n = 1000, mean = 2, sd = 1.2)
mean(y)
[1] 1.971083
sd(y)
[1] 1.22742
Another way to estimate the sample mean and standard deviation is using a generalized linear model. This is not necessary or recommended, but we’ll use this as a way to present gamma regression.
To estimate the mean and standard deviation of our sample we can fit an intercept-only model with glm(). To fit an intercept-only model, we use the syntax y ~ 1. Since we want to model the data as if it came from a normal distribution, we set family = gaussian(link = "identity"). (Gaussian is another name for the normal distribution.) The link = "identity" portion means do not transform the results. We save the model as m1 and save the summary of the model as s1.
m1 <- glm(y ~ 1, family = gaussian(link = "identity"))
s1 <- summary(m1)
s1
  Call:
  glm(formula = y ~ 1, family = gaussian(link = "identity"))

  Deviance Residuals:
      Min       1Q   Median       3Q      Max
  -3.6775  -0.8354  -0.0410   0.8674   4.3411

  Coefficients:
              Estimate Std. Error t value Pr(>|t|)
  (Intercept)  1.97108    0.03881   50.78   <2e-16 ***
  ---
  Signif. codes:  0 '***' 0.001 '**' 0.01 '*' 0.05 '.' 0.1 ' ' 1

  (Dispersion parameter for gaussian family taken to be 1.506559)

      Null deviance: 1505.1  on 999  degrees of freedom
  Residual deviance: 1505.1  on 999  degrees of freedom
  AIC: 3250.7

  Number of Fisher Scoring iterations: 2
Notice the intercept is simply the estimated mean of the data, 1.97108, which matches what we calculated using the mean() function above. The “dispersion parameter” is the estimated variance of the data, 1.506559. The square root of the dispersion parameter is the estimated standard deviation, 1.22742, which matches what we calculated using the sd() function above. We can extract the dispersion parameter from our summary object using s1$dispersion.
sqrt(s1$dispersion)
[1] 1.22742
The residual deviance is the sum of the squared residuals.
sum(residuals(m1)^2)
[1] 1505.052
If we divide the residual deviance by the degrees of freedom we also get the estimated variance/dispersion parameter. (Degrees of freedom is the number of observations minus the number of estimated coefficients. In this case, that’s 1000 - 1 = 999, since we only estimated one coefficient, the intercept.)
sum(residuals(m1)^2)/m1$df.residual
[1] 1.506559
Now let’s learn about the gamma distribution. Whereas the normal distribution has parameters called the mean and standard deviation, the gamma distribution has parameters called shape and scale. The R documentation uses \(\alpha\) (alpha) to represent the shape parameter and \(\sigma\) (sigma) to represent the scale parameter. We can plot a gamma distribution using the dgamma() function and sample from it using the rgamma() function. Both functions have arguments called shape and scale.
Let’s plot two gamma distributions using curve():
- one with shape = 1 and scale = 2
- one with shape = 7.5 and scale = 1
curve(dgamma(x, shape = 1, scale = 2), from = 0, to = 20,
      ylab = "",
      main = "Two gamma distributions")
curve(dgamma(x, shape = 7.5, scale = 1), from = 0, to = 20,
      add = TRUE, col = "red")
legend("topright", legend = c("shape = 1, scale = 2",
                              "shape = 7.5, scale = 1"),
       col = c("black", "red"), lty = 1)
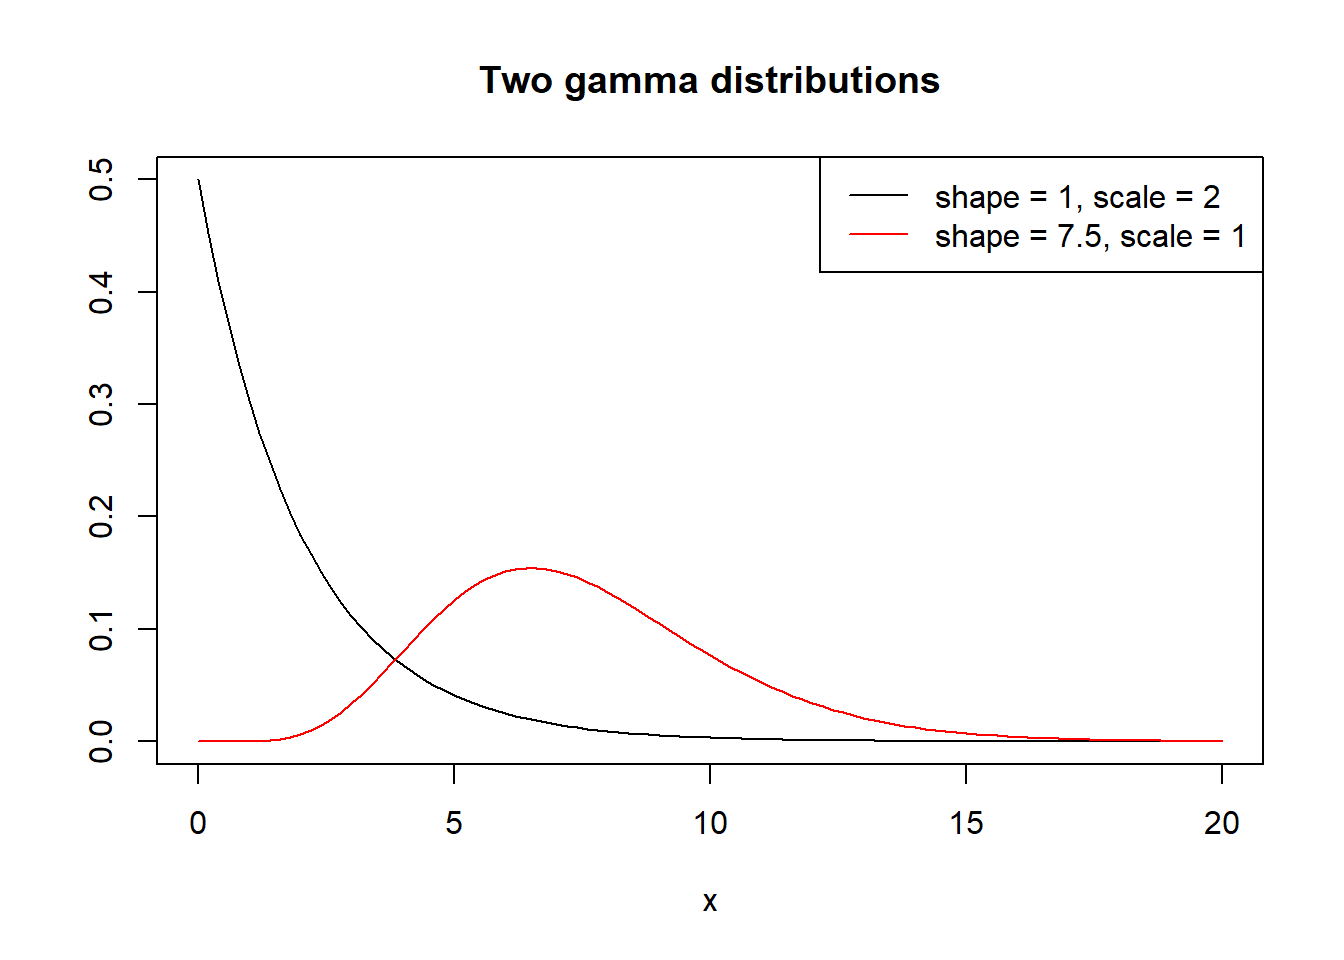
We get two very different looking distributions! Unlike the normal distribution, which is always symmetric around a single hump for the entire range of real numbers, the gamma distribution may or may not have a hump, is not symmetric, and only works for positive real numbers. Unless you have intimate knowledge of a gamma distribution, it is very difficult to sketch or visualize based on the shape and scale parameters.
However we can also describe gamma distributions using means and variances. This doesn’t make them easier to visualize in our mind’s eye, but it can help us better understand and work with them.
The mean and variance of a gamma distribution can be expressed as functions of the shape (\(\alpha\)) and scale (\(\sigma\)) parameters as follows:
$$\text{mean} = \alpha\sigma$$ $$\text{variance} = \alpha\sigma^2$$
If you look carefully at the variance, you’ll notice it’s the mean multiplied by the scale parameter. In other words, the variance is a function of the mean. A gamma distribution with a higher mean will have higher variance.
Let’s solve for the shape (\(\alpha\)) in terms of the mean and solve for the scale (\(\sigma\)) in terms of the variance. Using some basic algebra and substitution, we find the following:
$$\alpha = \frac{\text{mean}^2}{\text{variance}}$$ $$\sigma = \frac{\text{variance}}{\text{mean}}$$
This allows us to define gamma distributions using means and variances (or standard deviations) instead of shapes and scales.
For example, let’s say we want to sample 10,000 observations from a theoretical gamma distribution with a mean of 100 and a variance of 50. This translates into sampling from a gamma distribution with shape = \(100^2/50 = 200\) and scale = \(50/100 = 0.5\). Below we use the rgamma() function with the shape and scale arguments set to values calculated using the proposed mean and variance. Notice the estimated mean and variance are close to the “true values.” (Run the set.seed(999) code to generate the same “random” data.)
set.seed(999)
m <- 100 # true mean
v <- 50  # true variance
y2 <- rgamma(n = 10000, shape = (m^2)/v, scale = v/m)
mean(y2)
[1] 99.95558
var(y2)
[1] 50.92573
We can use the estimated mean and variance to get estimates for the shape and scale parameters using our formulas from above.
# shape
(mean(y2)^2)/var(y2)
[1] 196.19
# scale
var(y2)/mean(y2)
[1] 0.5094836
The distribution of the data look fairly symmetric, only slightly skewed to the right.
hist(y2)
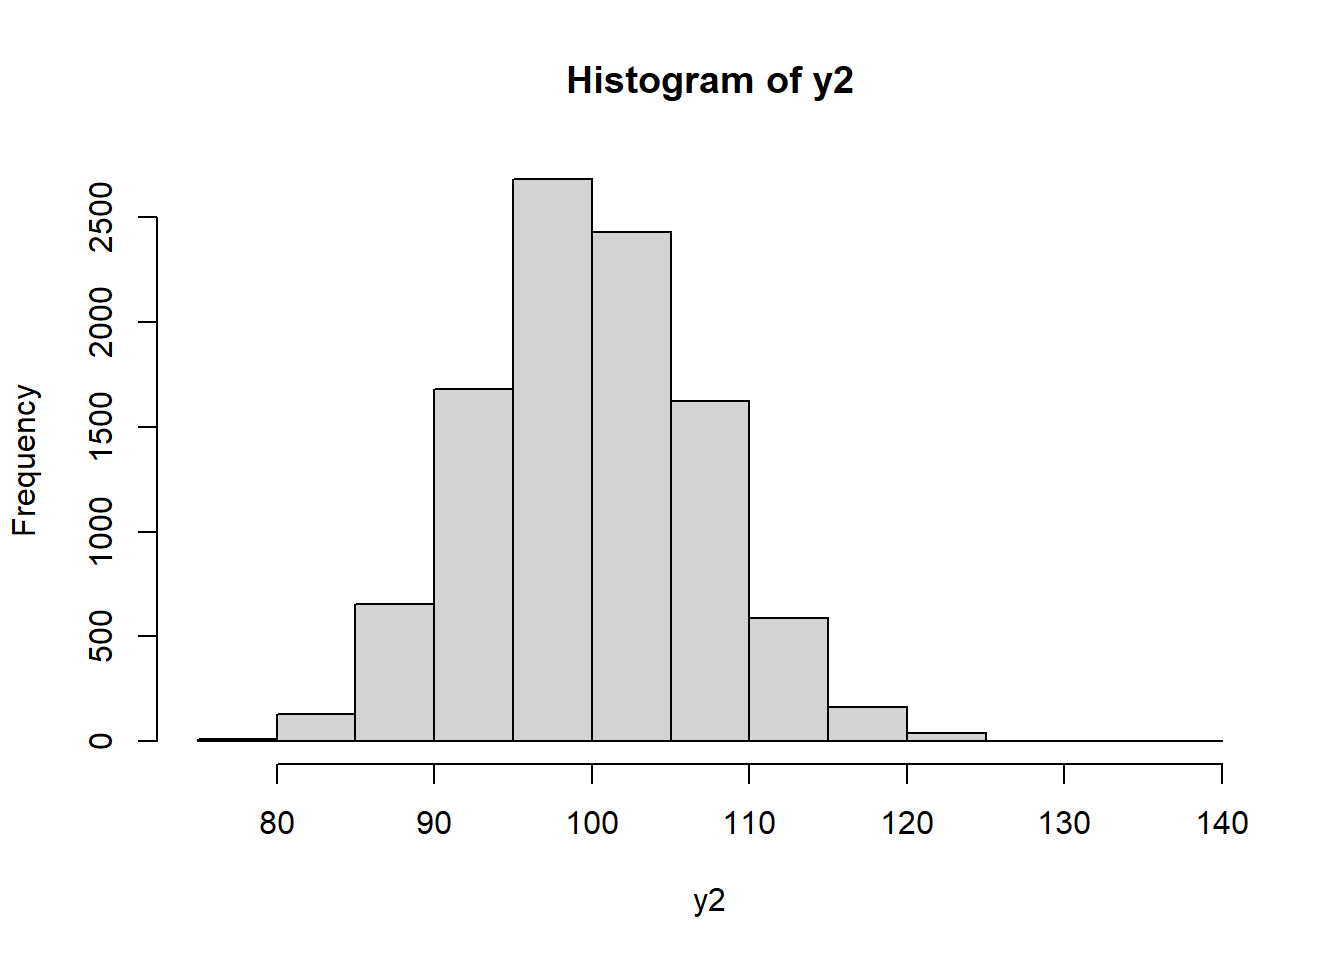
In fact, as the shape (\(\alpha\)) parameter gets bigger, the gamma distribution converges to a normal distribution. In this case, the shape parameter is pretty big at \((100^2)/50 = 200\).
As we did before, let’s use the glm() function to estimate the parameters of our data. This time, we set family = Gamma() with the link argument set to “identity”.
m2 <- glm(y2 ~ 1, family = Gamma(link = "identity"))
s2 <- summary(m2)
s2
  Call:
  glm(formula = y2 ~ 1, family = Gamma(link = "identity"))

  Deviance Residuals:
       Min        1Q    Median        3Q       Max
  -0.25849  -0.04973  -0.00236   0.04777   0.31941

  Coefficients:
              Estimate Std. Error t value Pr(>|t|)
  (Intercept) 99.95558    0.07136    1401   <2e-16 ***
  ---
  Signif. codes:  0 '***' 0.001 '**' 0.01 '*' 0.05 '.' 0.1 ' ' 1

  (Dispersion parameter for Gamma family taken to be 0.0050971)

      Null deviance: 50.986  on 9999  degrees of freedom
  Residual deviance: 50.986  on 9999  degrees of freedom
  AIC: 67647

  Number of Fisher Scoring iterations: 3
The intercept is the estimated mean which we calculated using the mean() function above.
The dispersion parameter is \(\frac{1}{\hat{\alpha}}\), or 1 over the estimated shape parameter. To get the estimated shape, we can divide the dispersion into 1.
shape <- 1/s2$dispersion
shape
[1] 196.19
This matches the estimated shape parameter we calculated above using the estimated mean and variance.
The mean divided by the shape parameter provides the estimated scale parameter, which matches what we calculated above. (We use as.numeric() to strip away the (Intercept) label.)
scale <- as.numeric(coef(m2))/shape
scale
[1] 0.5094836
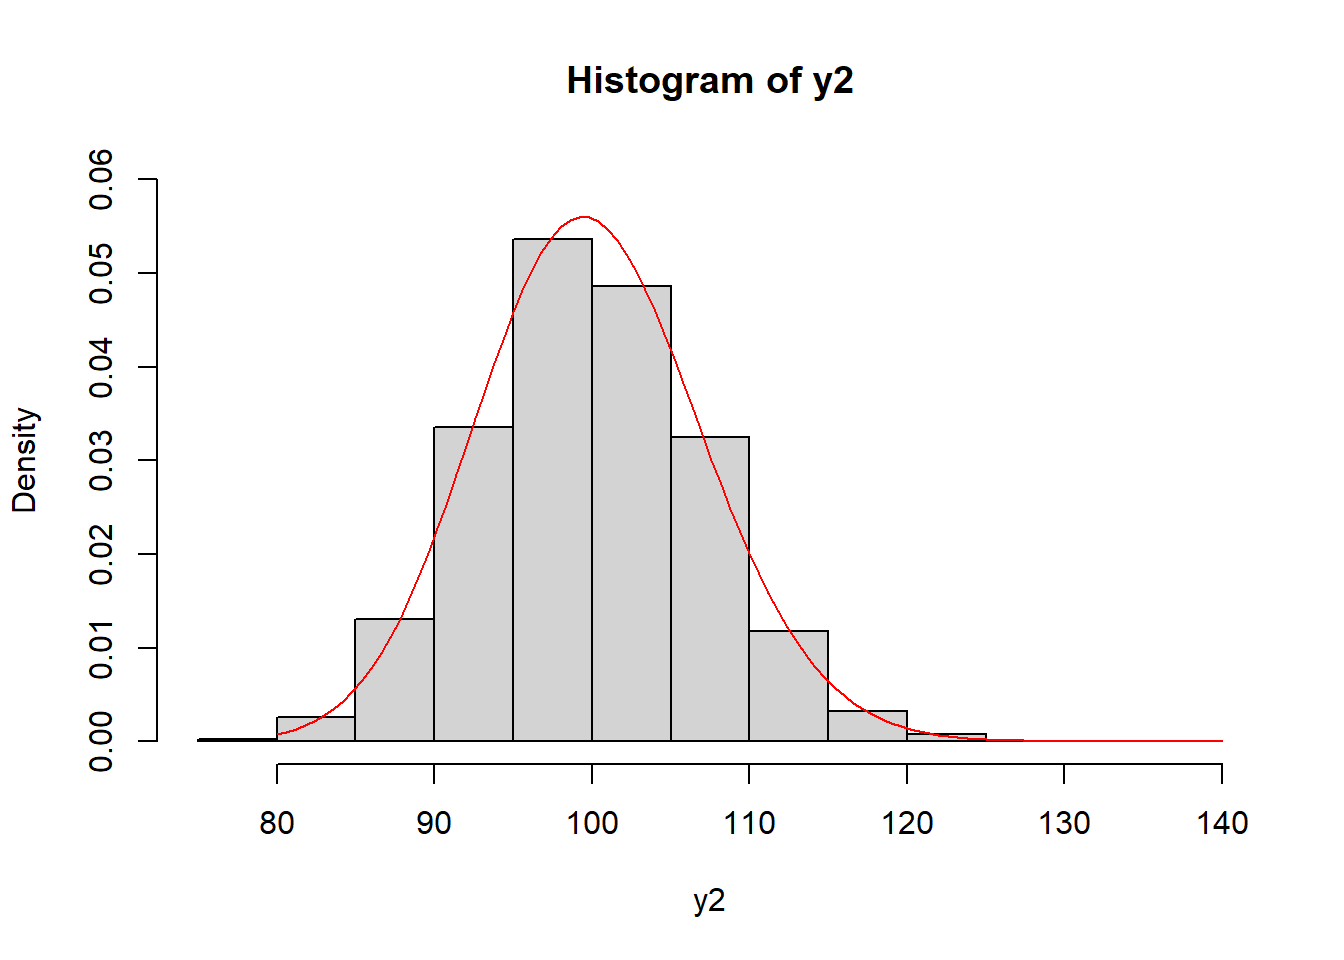
With our estimated shape and scale parameters, we can plot the estimated gamma distribution over the observed data using the curve() function.
hist(y2, freq = FALSE, ylim = c(0, 0.06))
curve(dgamma(x, shape = shape, scale = scale), from = 80, to = 140,
      col = "red", add = TRUE)
To get the estimated variance, we can use the formula above using shape and scale: \(\alpha \sigma^2\). It, too, matches what we calculated above using the var() function.
shape * scale^2
[1] 50.92573
To recover the variance using residuals, we need to sum the squared residuals with type = "response" and divide by the residual degrees of freedom (9,999) as follows:
sum(residuals(m2, type = "response")^2)/m2$df.residual
[1] 50.92573
The reported residual deviance is the sum of the squared deviance residuals: sum(residuals(m2, type = "deviance")^2). See this blog post for more information on deviance residuals.
Notice when we fit the gamma model we set link = "identity":
m2 <- glm(y2 ~ 1, family = Gamma(link = "identity"))
That meant we didn’t need to perform any transformations to get our estimated mean. The default link for Gamma() is “inverse”. Let’s try that and see how the output compares to the previous model.
m3 <- glm(y2 ~ 1, family = Gamma(link = "inverse"))
summary(m3)
  Call:
  glm(formula = y2 ~ 1, family = Gamma(link = "inverse"))

  Deviance Residuals:
       Min        1Q    Median        3Q       Max
  -0.25849  -0.04973  -0.00236   0.04777   0.31941

  Coefficients:
               Estimate Std. Error t value Pr(>|t|)
  (Intercept) 1.000e-02  7.143e-06    1401   <2e-16 ***
  ---
  Signif. codes:  0 '***' 0.001 '**' 0.01 '*' 0.05 '.' 0.1 ' ' 1

  (Dispersion parameter for Gamma family taken to be 0.0050971)

      Null deviance: 50.986  on 9999  degrees of freedom
  Residual deviance: 50.986  on 9999  degrees of freedom
  AIC: 67647

  Number of Fisher Scoring iterations: 4
The dispersion parameter and residual deviance are identical, however the intercept coefficient is different. To get the estimated mean on the original scale we have to take the inverse, or the reciprocal.
1/coef(m3)
  (Intercept)
     99.95558
Another link we can use is “log”.
m4 <- glm(y2 ~ 1, family = Gamma(link = "log"))
summary(m4)
  Call:
  glm(formula = y2 ~ 1, family = Gamma(link = "log"))

  Deviance Residuals:
       Min        1Q    Median        3Q       Max
  -0.25849  -0.04973  -0.00236   0.04777   0.31941

  Coefficients:
               Estimate Std. Error t value Pr(>|t|)
  (Intercept) 4.6047259  0.0007139    6450   <2e-16 ***
  ---
  Signif. codes:  0 '***' 0.001 '**' 0.01 '*' 0.05 '.' 0.1 ' ' 1

  (Dispersion parameter for Gamma family taken to be 0.0050971)

      Null deviance: 50.986  on 9999  degrees of freedom
  Residual deviance: 50.986  on 9999  degrees of freedom
  AIC: 67647

  Number of Fisher Scoring iterations: 3
Again, same dispersion parameter and residual deviance but different intercept coefficient. To get the estimated mean, we need to exponentiate.
exp(coef(m4))
  (Intercept)
     99.95558
Which link we choose for gamma regression is largely based on either preference or dealing with fitting issues. We might prefer the “identity” link for easier-to-interpret coefficients, but as we’ll see, a different choice of link can help eliminate warning and error messages about model fit.
Let’s work with some real data to further explore gamma regression. Below we import a sample of real estate data from Albemarle County, a county located in Virginia, USA. Of interest is modeling the total value of a home by predictors such as finished square feet, number of full bathrooms, lot size, etc.
URL <- 'http://static.lib.virginia.edu/statlab/materials/data/alb_homes.csv'
homes <- read.csv(file = URL)
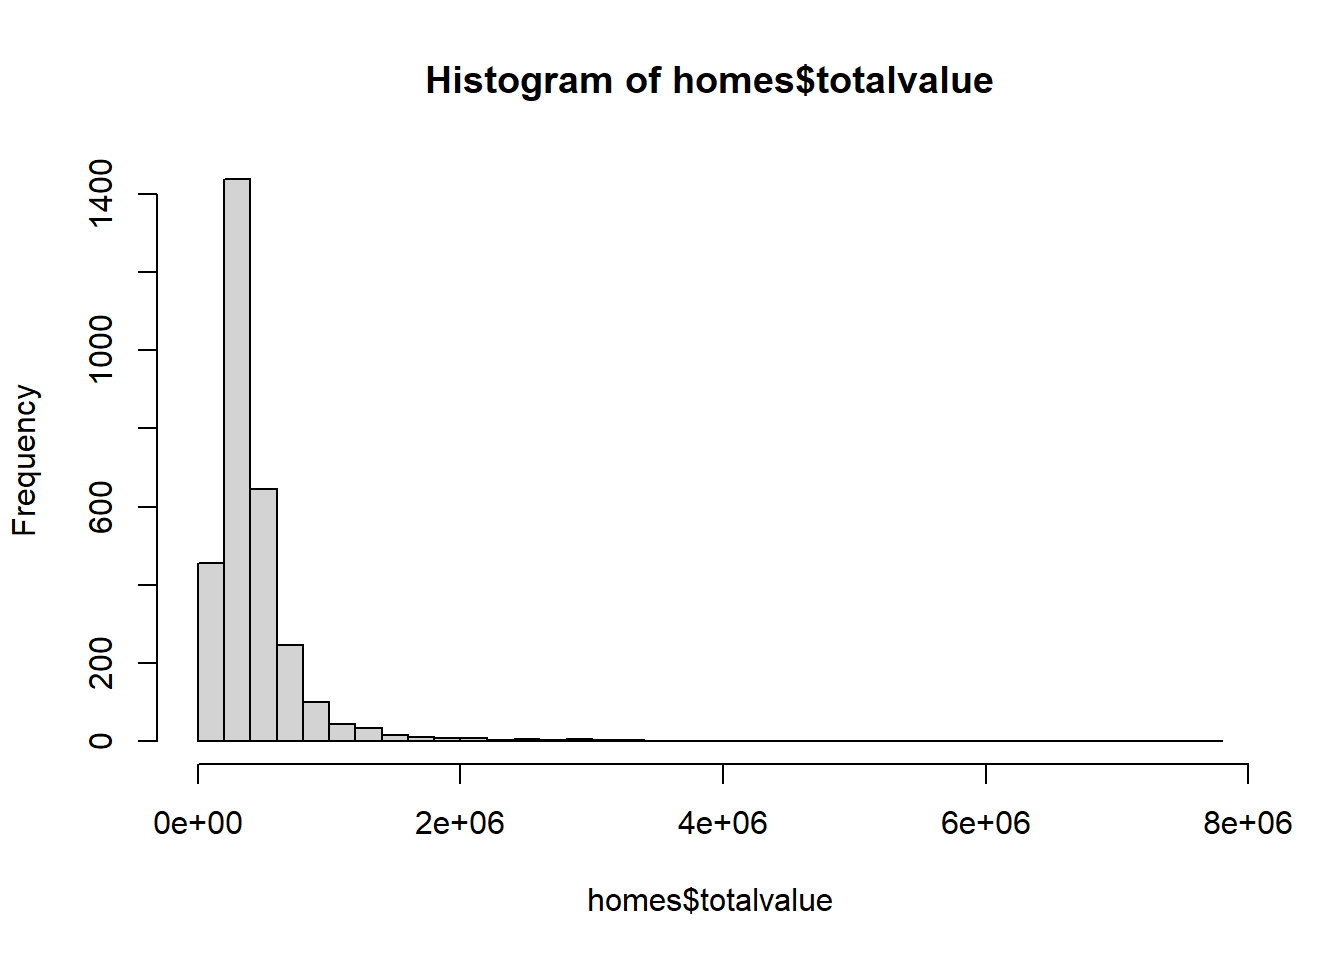
Our dependent variable, totalvalue, is positive and skewed. We might also imagine the mean value of more expensive homes having greater variability. Therefore a gamma model may be worth pursuing.
hist(homes$totalvalue, breaks = 30)
The simplest model to fit would be the intercept-only model. This means modeling the data with no predictors. For gamma models, this would mean estimating the shape and scale parameters of the data. Notice we set link = "log". This is in response to errors and warnings that we received when using link = "identity" and link = "inverse" to fit more complicated models.
mod0 <- glm(totalvalue ~ 1, data = homes,
          family = Gamma(link = "log"))
summary(mod0)
  Call:
  glm(formula = totalvalue ~ 1, family = Gamma(link = "log"), data = homes)

  Deviance Residuals:
      Min       1Q   Median       3Q      Max
  -2.3738  -0.5095  -0.2274   0.1358   5.3459

  Coefficients:
              Estimate Std. Error t value Pr(>|t|)
  (Intercept) 12.96448    0.01561   830.3   <2e-16 ***
  ---
  Signif. codes:  0 '***' 0.001 '**' 0.01 '*' 0.05 '.' 0.1 ' ' 1

  (Dispersion parameter for Gamma family taken to be 0.7374599)

      Null deviance: 1206  on 3024  degrees of freedom
  Residual deviance: 1206  on 3024  degrees of freedom
  AIC: 83236

  Number of Fisher Scoring iterations: 5
Notice the null and residual deviance are identical. The null deviance always reports deviance for the intercept-only model.
If we exponentiate the intercept we get the overall mean of totalvalue.
# same as mean(homes$totalvalue)
exp(coef(mod0))
  (Intercept)
     426973.7
We can also extract the estimated shape and scale parameters as follows:
# shape: 1 divided by dispersion parameter
m0_shape <- 1/0.7374599
# scale: mean/shape
m0_scale <- as.numeric(exp(coef(mod0)))/m0_shape
Now let’s use the estimated shape and scale parameters to draw the estimated gamma distribution on top of a histogram of the observed data.
hist(homes$totalvalue, breaks = 40, freq = FALSE)
curve(dgamma(x, shape = m0_shape, scale = m0_scale),
      from = 0, to = 8e6, col = "red", add = TRUE)
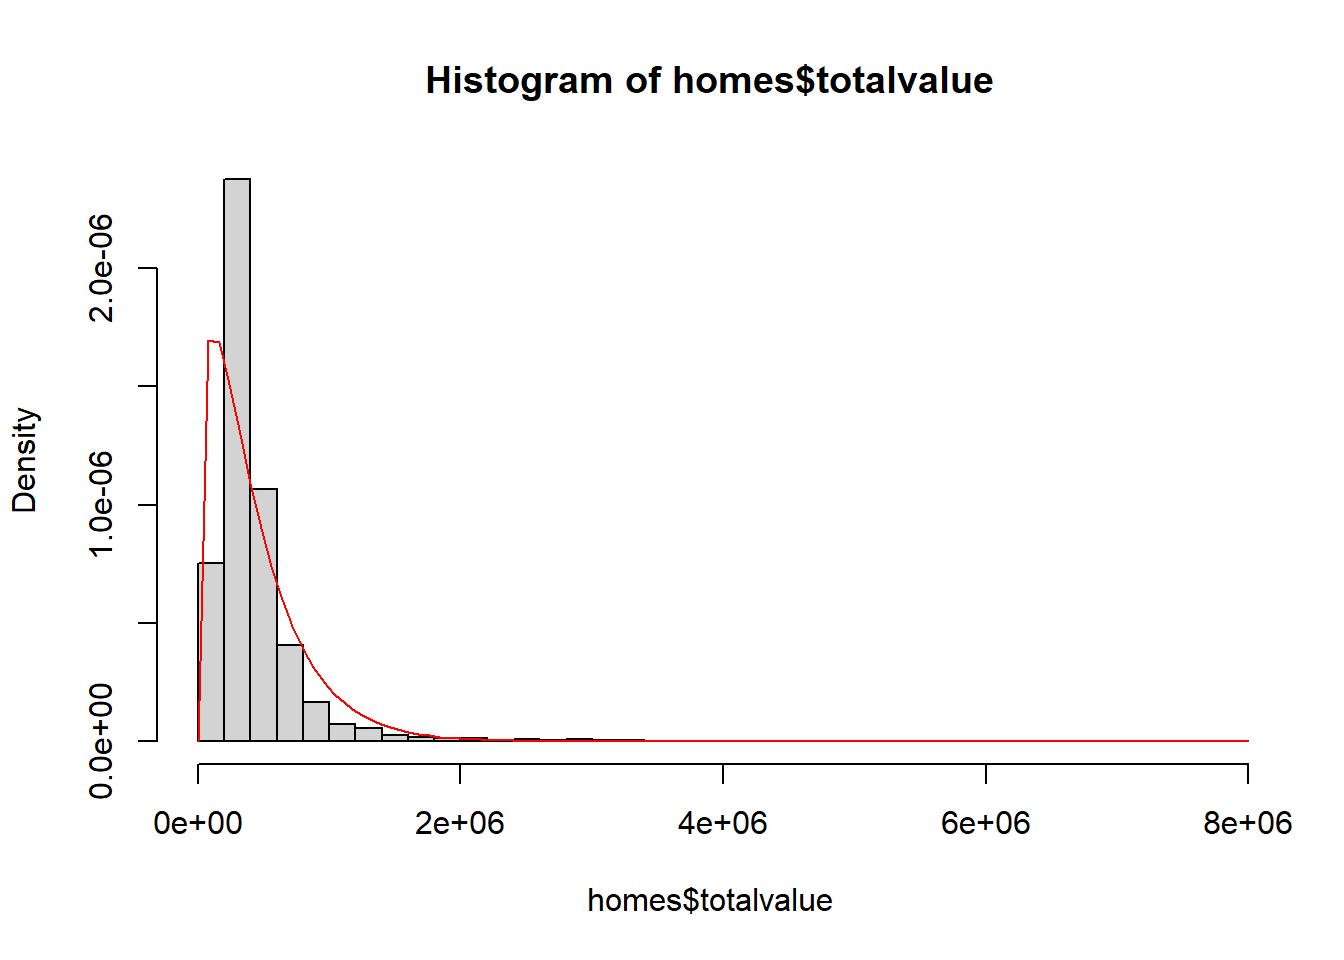
The fit is not very good. This suggests that we should consider using predictors to fit a model that better estimates the distribution of totalvalue. A simple model to consider is one that models totalvalue as a function of finsqft (finished square feet).
mod1 <- glm(totalvalue ~ finsqft, data = homes,
          family = Gamma(link = "log"))
When we compare the models, we see the second one has much lower AIC. Not surprisingly, square footage helps explain some of the variability in the total value of homes.
AIC(mod0, mod1)
       df      AIC
  mod0  2 83235.84
  mod1  3 79593.37
If we look at the summary output, we also see the residual deviance is much smaller than the null deviance (378.25 versus 1206). Recall the null deviance is for the intercept-only model. A model that fits better than an intercept-only model will have a residual deviance that is much smaller than the null deviance.
summary(mod1)
  Call:
  glm(formula = totalvalue ~ finsqft, family = Gamma(link = "log"),
      data = homes)

  Deviance Residuals:
      Min       1Q   Median       3Q      Max
  -2.1036  -0.2120  -0.0488   0.1062   4.1333

  Coefficients:
               Estimate Std. Error t value Pr(>|t|)
  (Intercept) 1.178e+01  1.986e-02  593.18   <2e-16 ***
  finsqft     5.081e-04  8.753e-06   58.04   <2e-16 ***
  ---
  Signif. codes:  0 '***' 0.001 '**' 0.01 '*' 0.05 '.' 0.1 ' ' 1

  (Dispersion parameter for Gamma family taken to be 0.2122692)

      Null deviance: 1206.00  on 3024  degrees of freedom
  Residual deviance:  378.25  on 3023  degrees of freedom
  AIC: 79593

  Number of Fisher Scoring iterations: 4
To interpret the coefficient for finsqft, we multiply by 100 and then exponentiate to get an estimated effect per 100 square feet. It appears that each additional 100 square feet added to a home increases its total value by about 5%. (Multiplying a value by 1.05 is the same as adding 5% to it.)
exp(coef(mod1)[2] * 100)
   finsqft
  1.052119
The estimated shape parameter is again 1 divided by the dispersion parameter, but the estimated scale parameter changes depending on finsqft. For example the estimated shape and scale parameters when finsqft = 2500 is as follows:
# shape: 1 divided by dispersion parameter
m1_shape <- 1/0.2122692
m1_shape
[1] 4.710999
# scale: mean/shape
m1_scale <- as.numeric(exp(coef(mod1)[1] + coef(mod1)[2] * 2500))/m1_shape
m1_scale
[1] 98965.39
This says, according to our model, that the total value of homes with 2500 finished square feet can be modeled as a gamma distribution with shape = 4.7109991 and scale = 98965.39. Below we draw 10,000 such samples from a gamma distribution with those parameter values and summarize the results using a 95% percentile interval.
tv <- rgamma(n = 10000, shape = m1_shape, scale = m1_scale)
pi <- quantile(tv, probs = c(0.025, 0.975))
pi
      2.5%    97.5%
  145268.6 969294.9
It looks like a home of that size, according to our model, could be anywhere from \$145,269 to \$969,295. We should note this is the estimated interval for the expected value of a single home. If we wanted an interval for the expected median value of homes with 2500 square feet, we would need to take the median of each sample and then calculate a percentile interval on the medians. Here’s one way to do this 10,000 times using the replicate() function.
med1 <- replicate(n = 10000, median(rgamma(n = 10000,
                                shape = m1_shape,
                                scale = m1_scale)))
ci <- quantile(med1, probs = c(0.025, 0.975))
ci
      2.5%    97.5%
  428695.7 438772.9
Now the interval is much tighter. At 2500 square feet, the expected median value is between \$428,696 and \$438,773, or thereabouts.
We can get the point estimate using predict(). We specify type = "response" to get the estimate on the original dollar scale instead of the log scale.
predict(mod1, newdata = data.frame(finsqft = 2500), type = "response")
         1
  466225.8
How good is this estimate? How good is this model? Let’s use our model to simulate data using all our observed finsqft values instead of just one value. Fortunately, R makes this rather easy with the simulate() function. Just give it our model and tell it how many simulations we want. We elect to do 50. After we simulate our data sets, we plot the original data as a smooth histogram and then overlay the 50 simulations (each as a smooth histogram) on top. A good model should simulate data that’s similar to our observed data.
sims1 <- simulate(mod1, nsim = 50)
plot(density(homes$totalvalue),
     main = "Simulated data for gamma model")
for(i in 1:50)lines(density(sims1[[i]]), col="grey80")
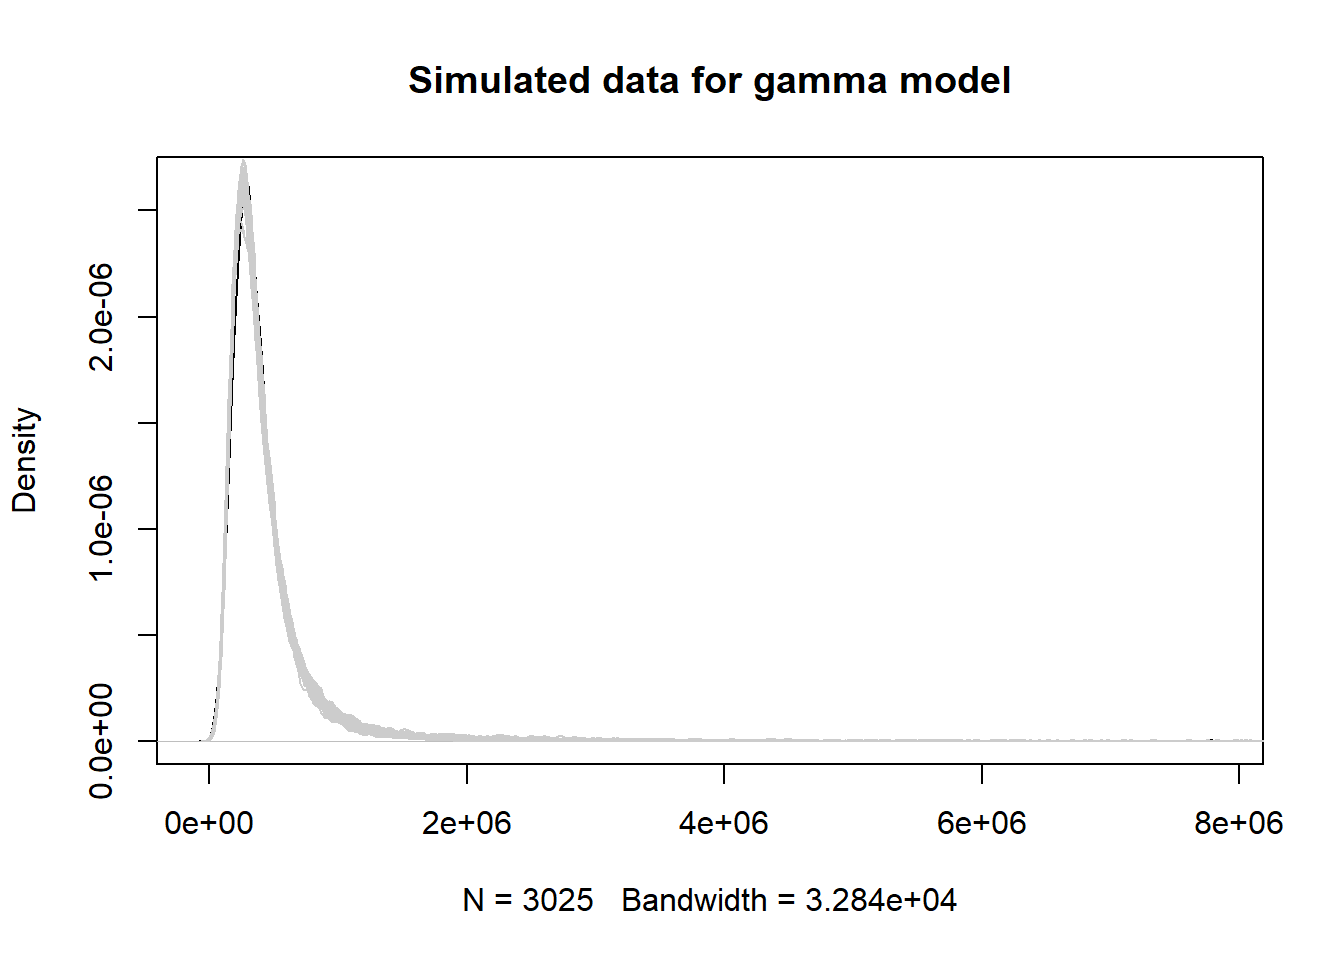
This looks pretty good! Apparently, just knowing the finished square feet of a home can give us a decent idea of what it might cost.
Since we just have a single predictor, we can plot our original data as a scatter plot and display the fitted model as a line with a confidence ribbon. The ggeffects package makes this pretty easy. We use the dollar() function from the scales package to format the y-axis labels.
library(ggeffects)
plot(ggpredict(mod1, terms = "finsqft"), show_data = TRUE,
     labels = scales::dollar) +
  ggplot2::ggtitle("Predicted values of totalvalue: gamma model")
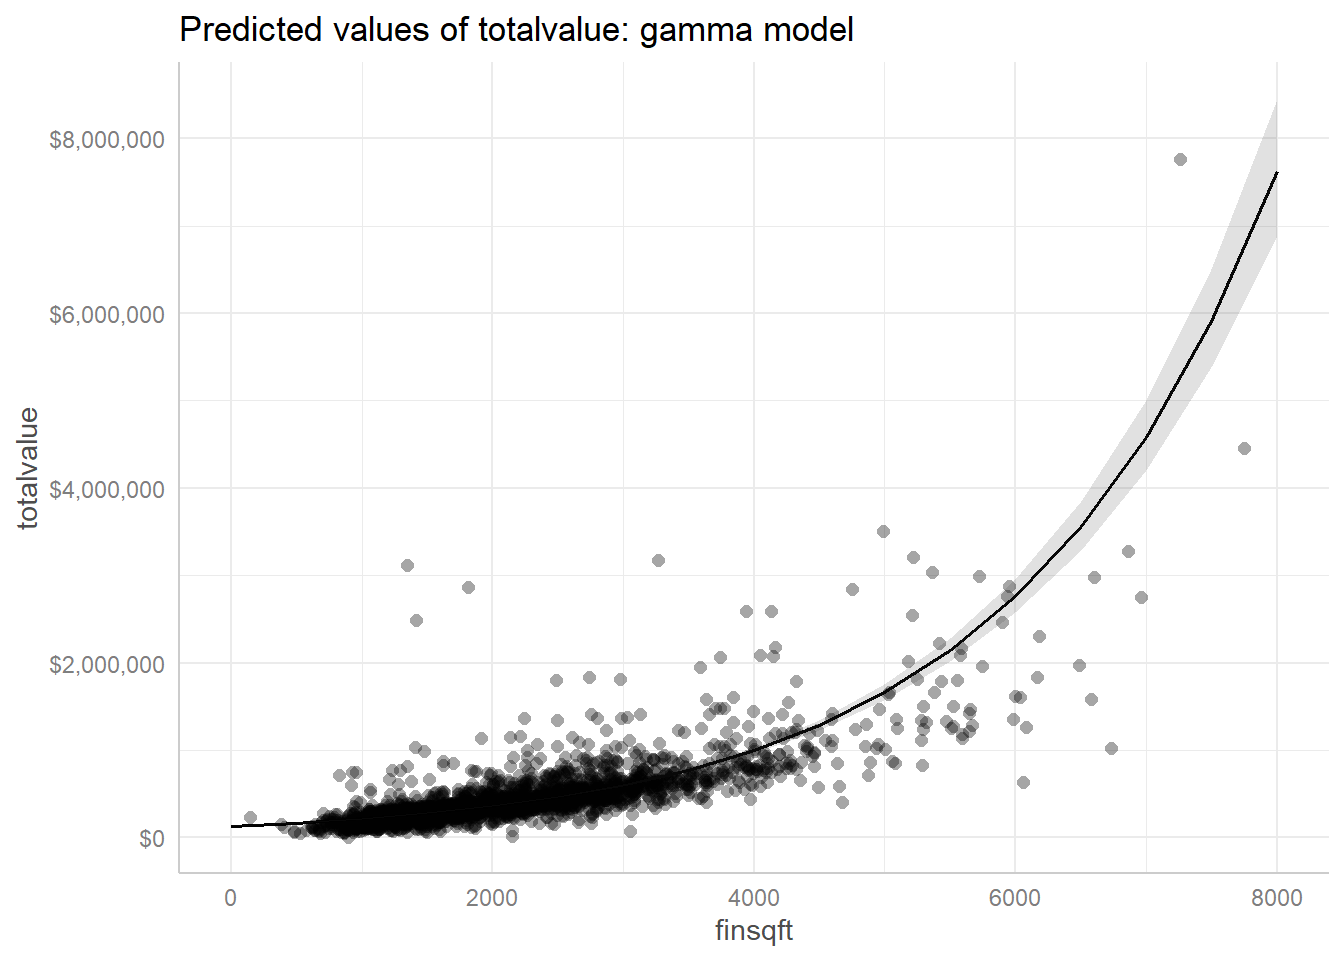
We have some very big and very expensive homes for which this model isn’t adequate, but for the bulk of the data (less than 4000 square feet, under $1,000,000), this appears to be a decent model for estimating the total value of a home. We encourage the interested reader to see if additional predictors can improve the model.
It’s worth pointing out that traditional linear modeling with a log transformation is sometimes just as good as gamma regression. Let’s demonstrate. Below we use lm() to fit a simple linear model with totalvalue log transformed. Notice the coefficient for finsqft is the same as the coefficient for the gamma model out to three decimal places. The interpretation is the same: Each additional 100 square feet added to a home is associated with an increase in its total value of about 5%.
mod2 <- lm(log(totalvalue) ~ finsqft, data = homes)
exp(coef(mod2)[2] * 100)
   finsqft
  1.052474
The estimated standard deviation is the residual standard error, but the estimated mean changes depending on finsqft. For example the estimated mean and standard deviation parameters when finsqft = 2500 is as follows:
# standard deviation:
m2_sd <- sigma(mod2)
m2_sd
[1] 0.3457787
# mean:
m2_mean <- as.numeric(coef(mod2)[1] + coef(mod2)[2] * 2500)
m2_mean
[1] 12.9914
This says, according to our linear model, that the log-transformed total value of homes with 2500 finished square feet can be modeled as a normal distribution with mean = 12.9913959 and standard deviation = 0.3457787. Below we draw 10,000 such samples from a normal distribution with those parameter values and summarize the results using a 95% percentile interval. Notice we have to exponentiate the result to convert back to dollar amounts.
tv2 <- rnorm(n = 10000, mean = m2_mean, sd = m2_sd)
pi2 <- exp(quantile(tv2, probs = c(0.025, 0.975)))
pi2
      2.5%    97.5%
  224413.5 861601.7
It looks like a home of that size, according to our linear model, could be anywhere from \$224,413 to \$861,602.
These results are similar to what we got with gamma regression, but notice the estimated interval is smaller. With gamma regression, larger estimated values have larger variance. With a linear model, the estimated standard deviation is assumed to be constant.
As before, this interval is for the expected value for any single home with 2500 finished square feet. To get the expected median value for homes with 2500 finished square feet we need to take the median of many samples.
med2 <- replicate(n = 10000, median(rnorm(n = 10000,
                                          mean = m2_mean,
                                          sd = m2_sd)))
ci2 <- quantile(exp(med2), probs = c(0.025, 0.975))
ci2
      2.5%    97.5%
  434842.8 442346.3
This is a much smaller interval, indicating higher confidence in estimating a summary statistic about many homes versus estimating a specific value for a given home.
We can get the point estimate using predict(). Again we have to exponentiate to get the estimate on the original dollar scale instead of the log scale.
exp(predict(mod2, newdata = data.frame(finsqft = 2500)))
         1
  438623.2
In addition to point estimates, the predict() method for lm objects can return confidence and prediction intervals, something the predict() method for glm objects does not do. Set interval = "confidence" for a 95% confidence interval on the expected mean, and set interval = "prediction" for a 95% prediction interval on a single observation.
# CI for mean
exp(predict(mod2, newdata = data.frame(finsqft = 2500),
            interval = "confidence"))
         fit      lwr      upr
  1 438623.2 432706.8 444620.4
# PI for single observation
exp(predict(mod2, newdata = data.frame(finsqft = 2500),
            interval = "prediction"))
         fit      lwr      upr
  1 438623.2 222631.8 864163.5
The confidence interval on the mean isn’t much different than what we calculated for the median using simulation. Since our data are so skewed we prefer to report the median as a summary statistic. The prediction interval is also very similar to what we calculated using simulation.
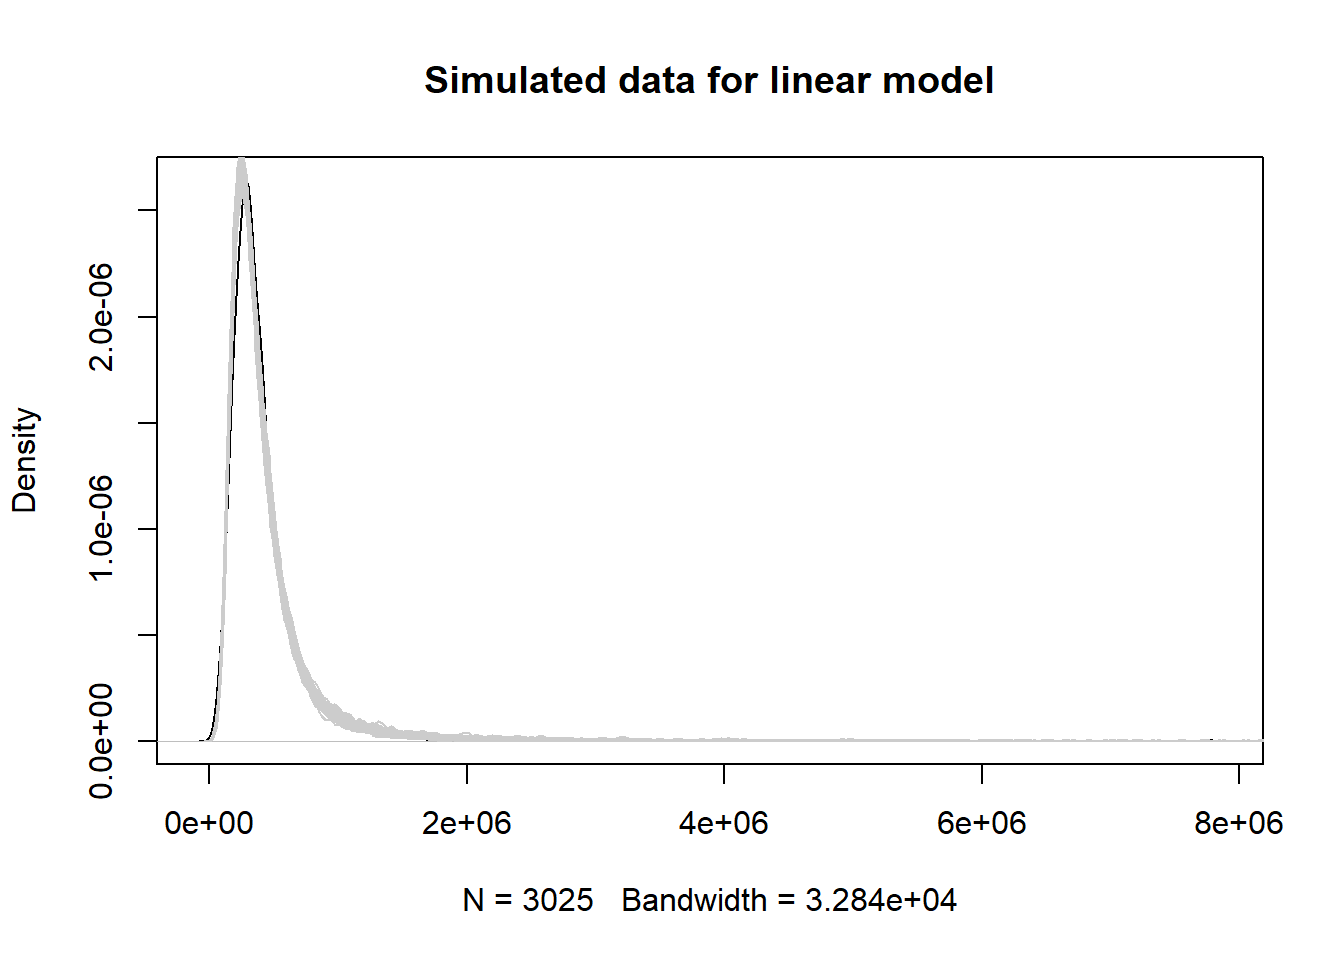
The model-simulated data from the linear model appear to capture the features of the original data. It’s hard to see any difference from this plot and the same plot for the gamma model.
sims2 <- exp(simulate(mod2, nsim = 50))
plot(density(homes$totalvalue),
     main = "Simulated data for linear model")
for(i in 1:50)lines(density(sims2[[i]]), col="grey80")
Finally, the fitted line through the scatterplot of data looks virtually identical to the version we created using the gamma model.
plot(ggpredict(mod2, terms = "finsqft"), show_data = TRUE,
     labels = scales::dollar) +
  ggplot2::ggtitle("Predicted values of totalvalue: linear model")
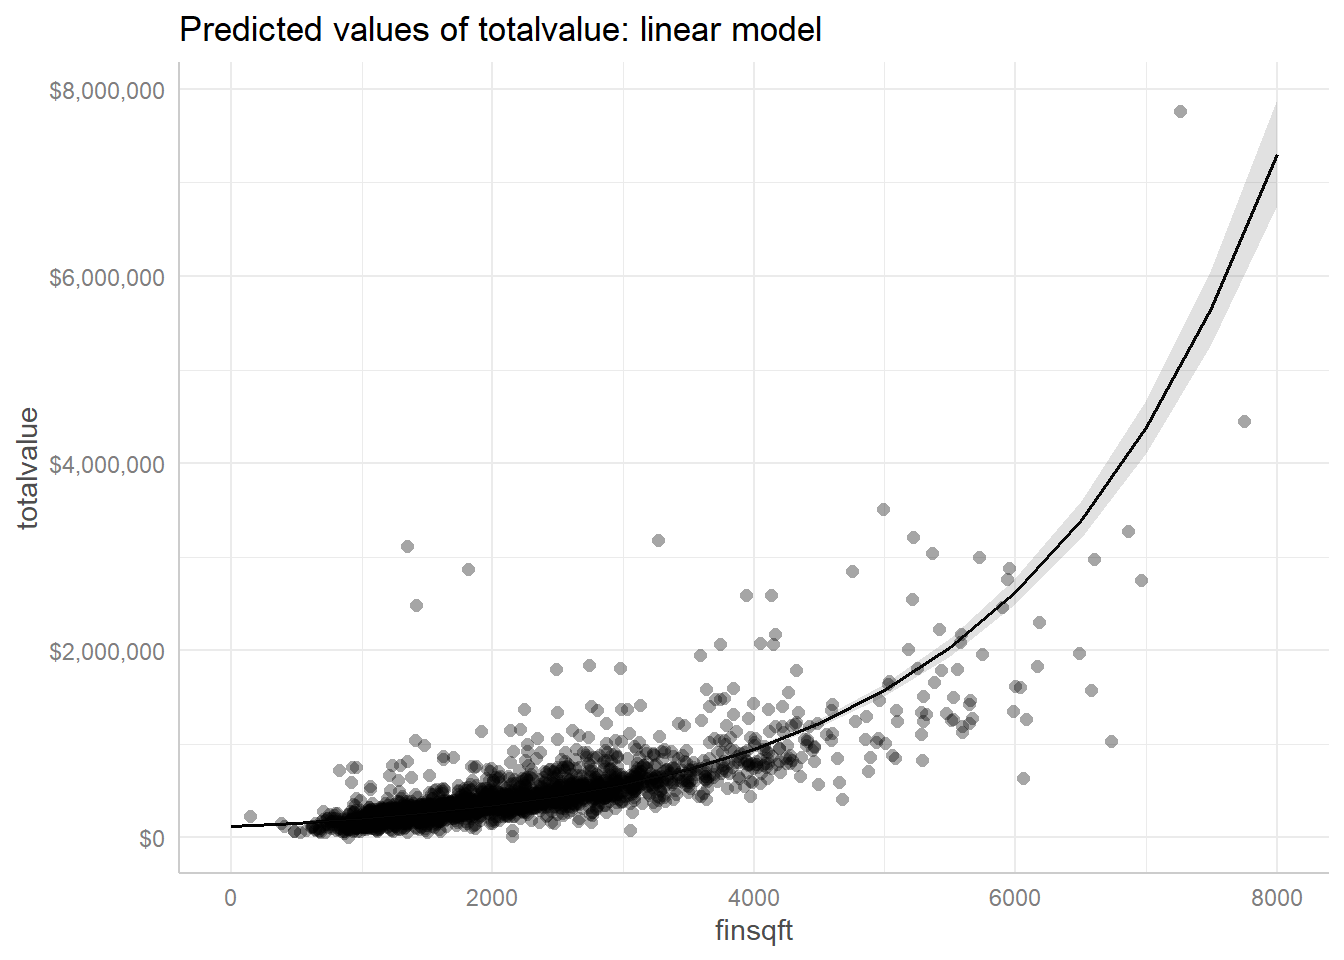
It’s difficult to directly compare these two models. The gamma model uses a log transformation on the expected total value, but the linear model actually log transforms the total values prior to modeling. The AIC values are on different scales and inappropriate to compare. Which model we prefer may simply depend on our audience and whether or not they would feel comfortable with results from a gamma model. In looking at the scatterplot above, it does seem like variance in totalvalue increases with higher values of finsqft. In that case, we may prefer a gamma model. But we would need to weigh the added complexity of a gamma model against the comfort and familiarity of a linear model.
In any case, we hope you now have a better understanding of gamma distributions, gamma regression, and when you may want to employ it with your own data.
R session details
The analysis was done using the R Statistical language (v4.5.1; R Core Team, 2025) on Windows 11 x64 using the package ggeffects (v2.3.0).
References
- Agresti, A., & Kateri, M. (2021). Foundations of statistical science for data scientists. CRC Press.
- Albemarle County. (2020). GIS Data - Parcels. https://www.albemarle.org/government/information-technology/geographic-information-system-gis-mapping/gis-data
- Lüdecke, D. (2018). ggeffects: Tidy data frames of marginal effects from regression models.” Journal of Open Source Software, 3(26), 772. https://doi.org/10.21105/joss.00772
- R Core Team. (2022). R: A language and environment for statistical computing. R Foundation for Statistical Computing. https://www.R-project.org/
- Wickham, H. (2016). ggplot2: Elegant graphics for data analysis. Springer-Verlag.
Clay Ford
Statistical Research Consultant
University of Virginia Library
October 28, 2022
For questions or clarifications regarding this article, contact statlab@virginia.edu.
View the entire collection of UVA Library StatLab articles, or learn how to cite.