
The Analysis of Covariance, or ANCOVA, is a regression model that includes both categorical and numeric predictors, often just one of each. It is commonly used to analyze a follow-up numeric response after exposure to various treatments, controlling for a baseline measure of that same response. For example, given two subjects with the same baseline value of the study outcome, one in a treated group and the other in a control group, will the subjects have different follow-up outcomes on average?
To demonstrate, we’ll replicate an example presented in chapter 22 of Kutner, et al. (2005). A company proposes to study the effects of different types of promotion tactics on sales of a product. Three different promotions, or treatments, will be considered:
- free samples of product for customers and regular shelf space
- additional shelf space
- additional display at end of aisles
Fifteen stores are selected and five each are randomized to each treatment group. Prior to implementing the different promotion treatments, existing products sales are recorded (i.e., the baseline measure). Then the new promotions are implemented for a period of time and the products sales are recorded again (i.e., the follow-up measure).
Let’s read the data into R and prepare for analysis.
d <- read.table("https://static.lib.virginia.edu/statlab/materials/data/CH22TA01.txt")
names(d) <- c("post", "baseline","trt","store")
d$trt <- factor(d$trt)
head(d)
    post baseline trt store
  1   38       21   1     1
  2   39       26   1     2
  3   36       22   1     3
  4   45       28   1     4
  5   33       19   1     5
  6   43       34   2     1
We see that store 1 in treatment group 1 had baseline sales of 21 cases and follow-up sales, or “post” sales, of 38 cases.
Looking at mean “post” sales, it seems treatments 1 and 2 were better than treatment 3
dm <- aggregate(post ~ trt, data = d, mean)
dm
    trt post
  1   1 38.2
  2   2 36.0
  3   3 27.2
Let’s visualize the raw “post” data along with the means (in red) using ggplot2 (Wickham, 2016).
library(ggplot2)
ggplot(d) +
  aes(x = trt, y = post) +
  geom_point() +
  geom_point(aes(y = post), dm, color = "red", size = 3)
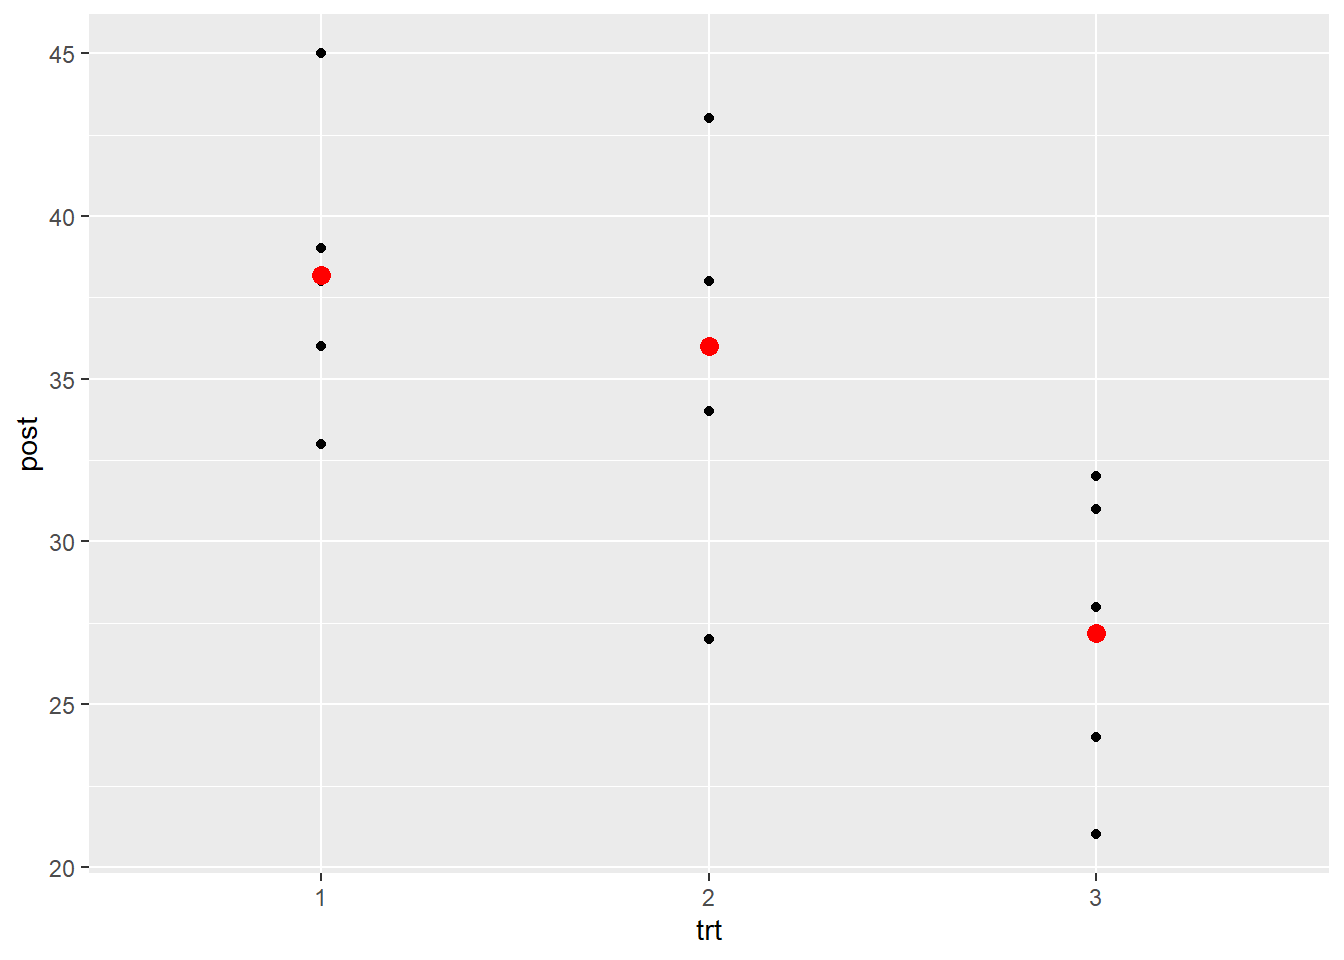
We see quite a bit of variability around the means.
Now let’s incorporate the baseline sales and plot a straight trendline to summarize the relationship between baseline and post sales for each treatment group. We change the color scale to use the "Set2" palette from the RColorBrewer package, a colorblind friendly palette.
ggplot(d) +
  aes(x = baseline, y = post, color = trt) +
  geom_point() +
  geom_smooth(method = "lm", se = F) +
  scale_color_brewer(palette = "Set2")
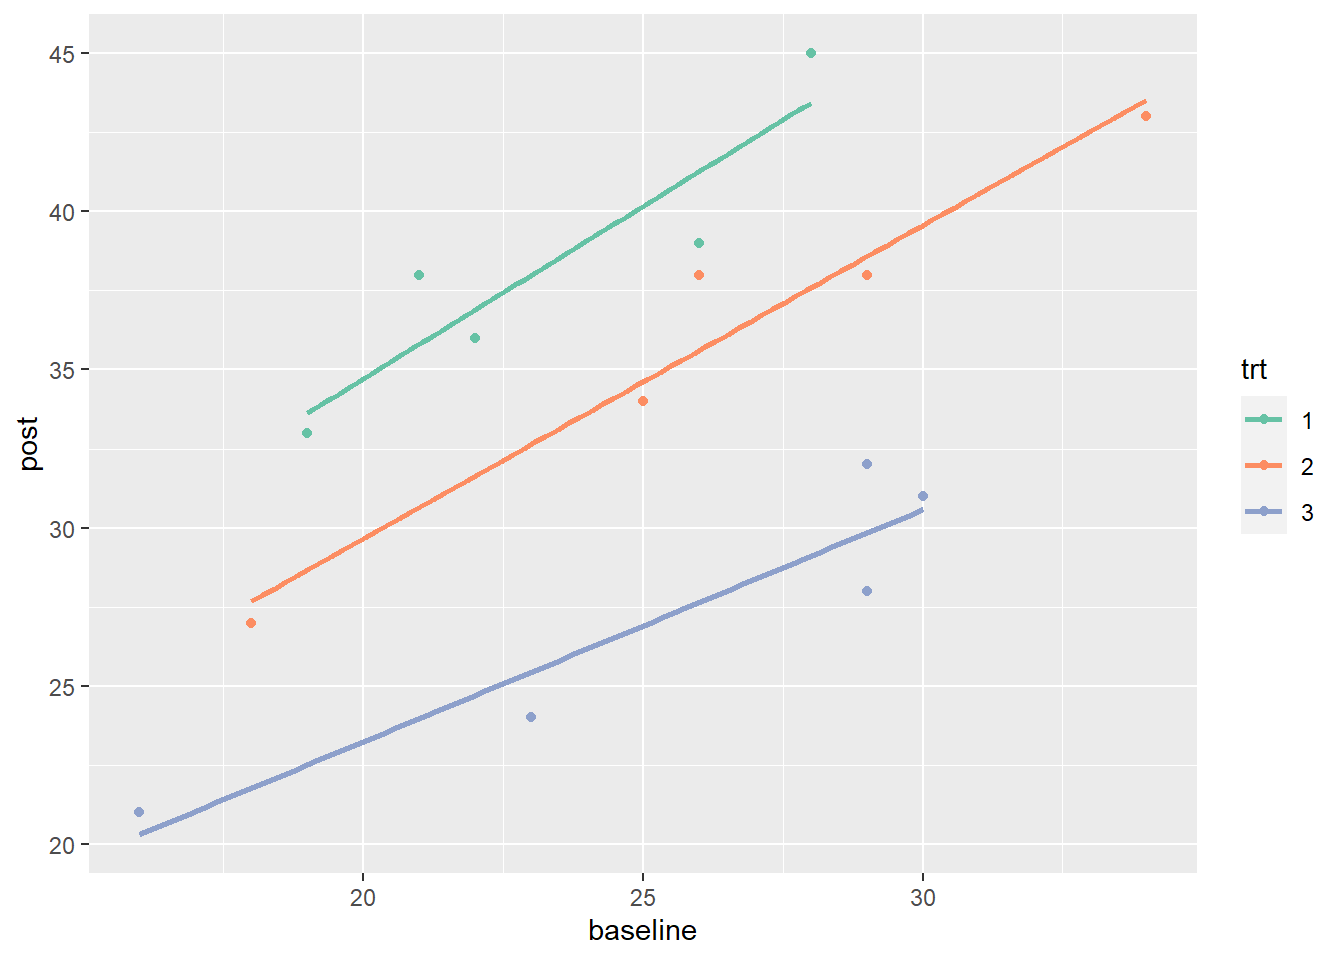
Notice the variability within each group is much lower compared to the variability in the previous plot. This is because follow-up sales are correlated with baseline sales. Incorporating this information allows us to make more precise estimates of treatment effects. Also notice the variability within groups appears to be similar across the groups. This is a key assumption of ANCOVA.
Let’s proceed to analyze this data using ANCOVA. For this we use the workhorse lm() function. Below we model “post” as a function of the “baseline” measure and the “trt” grouping variable. We save the model as “m” and investigate the treatment effect using the anova() function. That’s right, the anova() function, not ancova()! Remember, ANCOVA is just a name for a special type of regression model. The base R anova() function allows us to investigate which predictors are explaining variability in our response through a series of partial F tests.
m <- lm(post ~ baseline + trt, data = d)
anova(m)
  Analysis of Variance Table

  Response: post
            Df Sum Sq Mean Sq F value    Pr(>F)
  baseline   1 190.68 190.678  54.379 1.405e-05 ***
  trt        2 417.15 208.575  59.483 1.264e-06 ***
  Residuals 11  38.57   3.506
  ---
  Signif. codes:  0 '***' 0.001 '**' 0.01 '*' 0.05 '.' 0.1 ' ' 1
The second line of the output tests the null hypothesis that “trt” has no effect on “post” after controlling for “baseline”. The small p-value provides evidence against the null. It appears that even after taking baseline measure into account, additional variability between “post” sales can be explained by treatment groups. This leads us to believe that at least one of the promotional strategies may be better than the others.
It’s worth noting that the anova() function uses Type I sums of squares, which means the order of the variables in the model matters. If we switch the order of the predictors, post ~ trt + baseline, data = d, we get different results. Observe:
# Notice trt comes before baseline
m2 <- lm(post ~ trt + baseline, data = d)
anova(m2)
  Analysis of Variance Table

  Response: post
            Df Sum Sq Mean Sq F value    Pr(>F)
  trt        2 338.80 169.400  48.310 3.566e-06 ***
  baseline   1 269.03 269.029  76.723 2.731e-06 ***
  Residuals 11  38.57   3.506
  ---
  Signif. codes:  0 '***' 0.001 '**' 0.01 '*' 0.05 '.' 0.1 ' ' 1
The first line now tests the null hypothesis that “trt” has no effect on “post” without accounting for baseline sales. For this model, the appropriate function to use would be the Anova() function from the car package, which uses Type II sums of squares. Order of the variables does not matter in Type II sums of squares. Each predictor is tested assuming the other is in the model. Notice the result for “trt” matches the result in anova(m).
car::Anova(m2)
  Anova Table (Type II tests)

  Response: post
            Sum Sq Df F value    Pr(>F)
  trt       417.15  2  59.483 1.264e-06 ***
  baseline  269.03  1  76.723 2.731e-06 ***
  Residuals  38.57 11
  ---
  Signif. codes:  0 '***' 0.001 '**' 0.01 '*' 0.05 '.' 0.1 ' ' 1
The same tests can be run using base R’s drop1() function, which compares the full model to a model without the predictor. Notice we need to specify test = "F".
drop1(m2, test = "F")
  Single term deletions

  Model:
  post ~ trt + baseline
           Df Sum of Sq    RSS    AIC F value    Pr(>F)
  <none>                 38.57 22.167
  trt       2    417.15 455.72 55.207  59.483 1.264e-06 ***
  baseline  1    269.03 307.60 51.311  76.723 2.731e-06 ***
  ---
  Signif. codes:  0 '***' 0.001 '**' 0.01 '*' 0.05 '.' 0.1 ' ' 1
To learn more about Type I and Type II sums of squares, we recommend the article Anova – Type I/II/III SS explained.
Before we get too excited about our results, we should run some model diagnostics to verify important assumptions: constant variance of residuals within groups and normality of residuals.
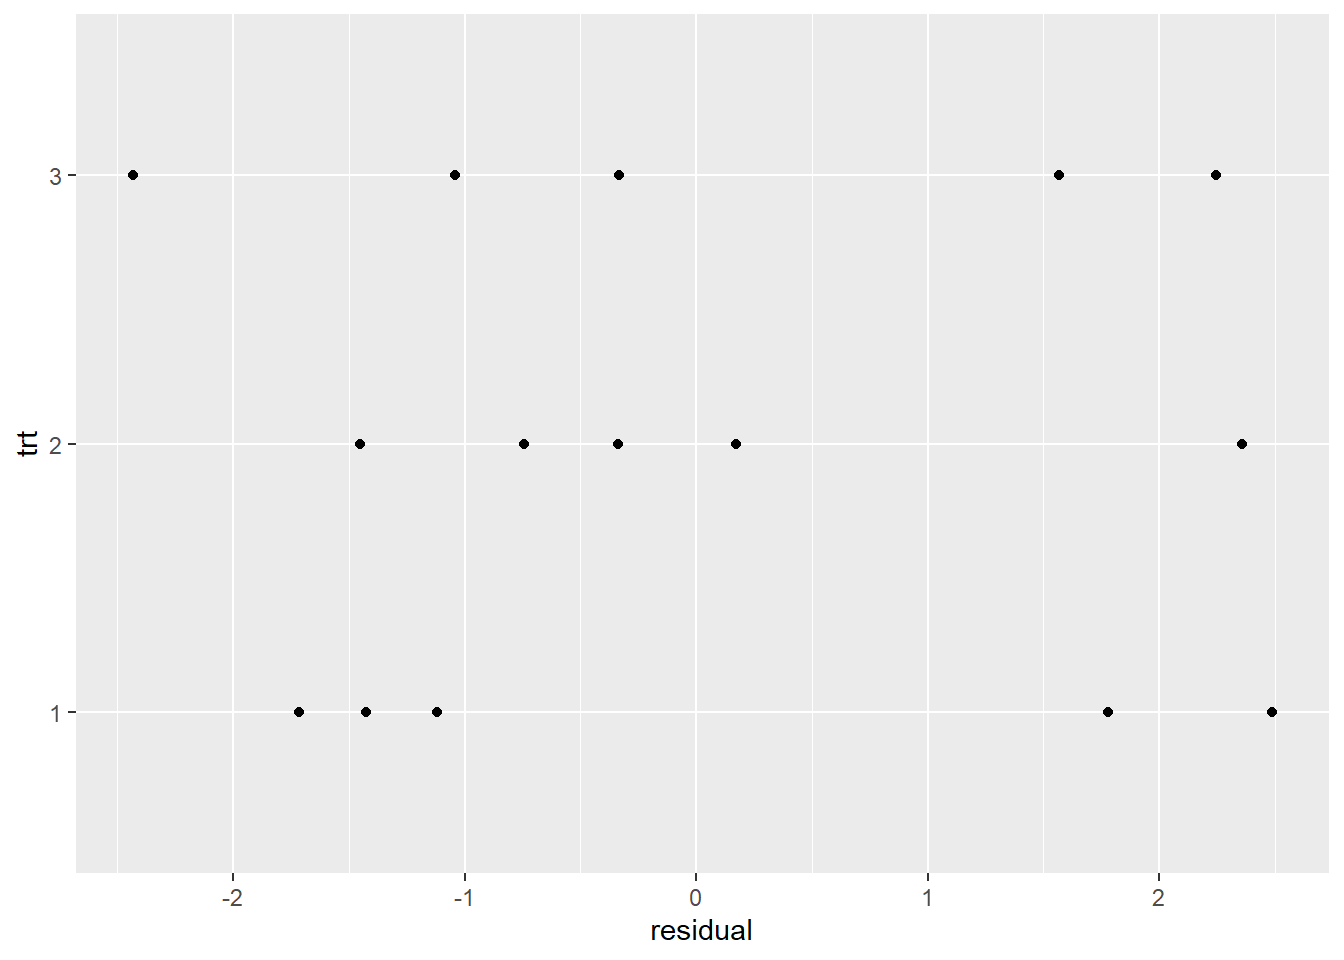
To check constant variance, we can look at residuals by treatment group. Below we extract residuals from our model, add them to our data, and create a dot plot of residuals by treatment group. The variability of the residuals looks similar between the groups, which we like to see.
d$residual <- residuals(m)
ggplot(d) +
  aes(y = trt, x = residual) +
  geom_point()
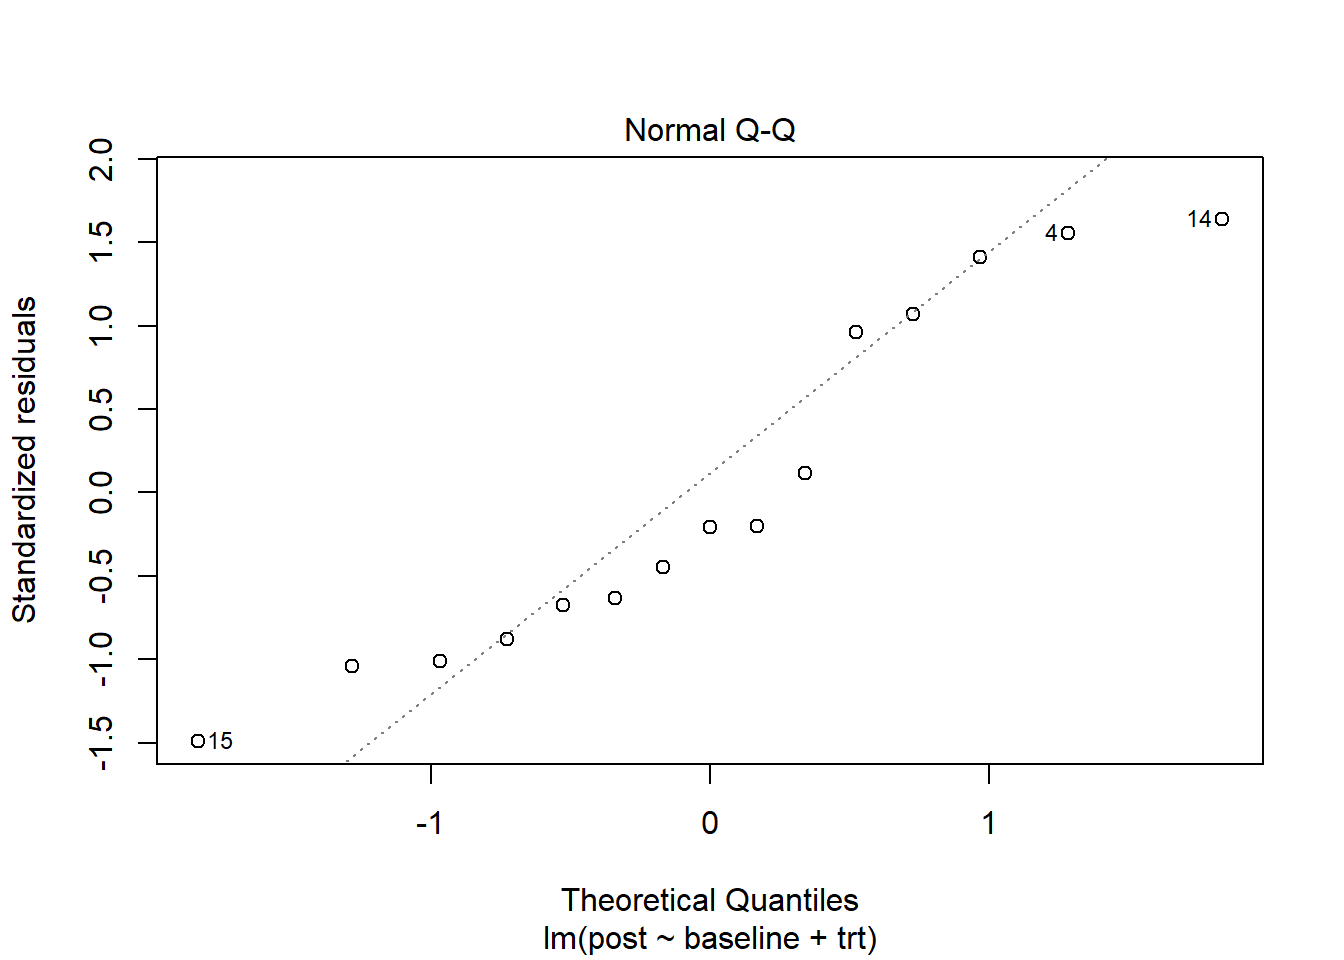
Calling plot() on our model object and specifying which = 2 produces a QQ plot of residuals. If our residuals are normally distributed, we expect to see a scatter plot that forms a straight diagonal line. (See our article, Understanding QQ Plots, for more information.) It appears there are slight departures from normality but nothing too alarming.
plot(m, which = 2)
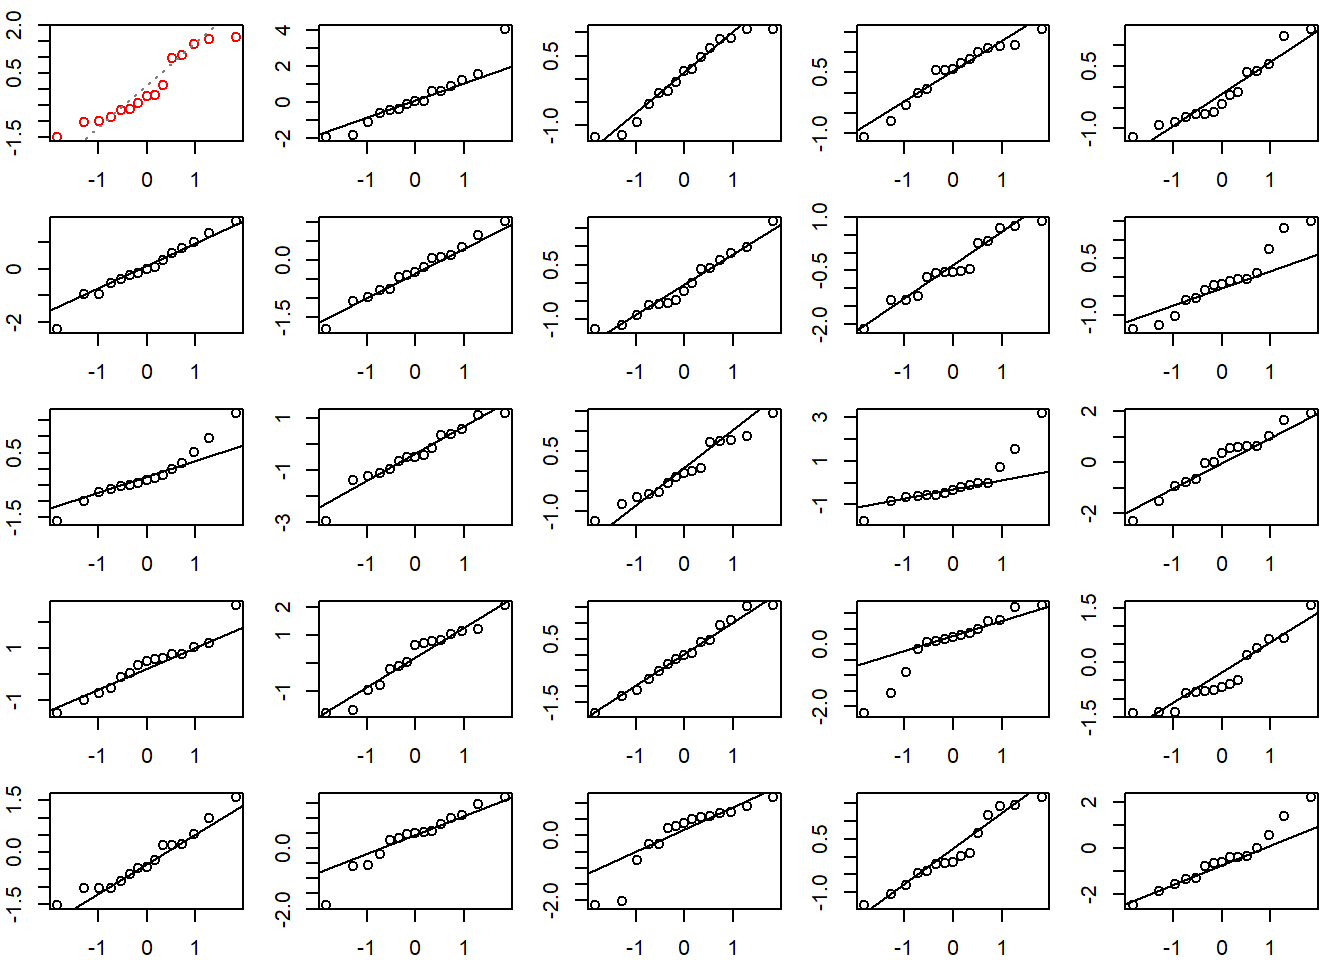
When assessing a QQ plot, it can be helpful to compare it to other QQ plots created with normally distributed data. Below we do just that. The top left QQ plot with red dots is our original residual QQ plot. The other QQ plots are for random draws from a standard normal distribution. Our residual QQ plot doesn’t look that different from the other plots, which makes us feel satisfied with the normality assumption.
# create a 5x5 grid of plotting areas
op <- par(mar = c(2,2,1,1), mfrow = c(5,5))
# create model qq plot
plot(m, which = 2, caption= "", id.n = 0, col = "red")
# now create 24 qq plots using normal data
for(i in 1:24){
  s <- rnorm(nrow(d))
  qqnorm(s, xlab = "", ylab = "", main = "")
  qqline(s)
}
# reset plotting parameters
par(op)
Another assumption of our ANCOVA model is that the baseline effect is constant regardless of treatment group. In other words, the slopes of the linear trend lines are parallel. This seems to be the case in the second exploratory plot above. We specified this assumption in our model by making the effects additive. We have two main effects: “baseline” and “trt”. The effect of one has no effect on the other according to our model specification. But this may not be correct. We can formally test this assumption by fitting a new model where “baseline” and “trt” interact and then testing whether the interaction is warranted. This is sometimes called a Test for Parallel Slopes.
Below we specify an interaction using the formula syntax baseline * trt and save the model as “m_int”. As before we use the anova() function to test the null hypothesis that there is no interaction between “baseline” and “trt” when it comes to explaining variability in “post”.
m_int <- lm(post ~ baseline * trt, data = d)
anova(m_int)
  Analysis of Variance Table

  Response: post
               Df Sum Sq Mean Sq F value    Pr(>F)
  baseline      1 190.68 190.678 54.4434 4.198e-05 ***
  trt           2 417.15 208.575 59.5536 6.457e-06 ***
  baseline:trt  2   7.05   3.525  1.0065    0.4032
  Residuals     9  31.52   3.502
  ---
  Signif. codes:  0 '***' 0.001 '**' 0.01 '*' 0.05 '.' 0.1 ' ' 1
The row labeled “baseline:trt” has a large p-value, which leads us to not reject the null of no interaction effect. It seems parallel linear trend lines are a safe assumption.
Now that we’ve determined “trt” seems to have some effect on “post” after controlling for “baseline”, how can we estimate those effects? Which promotion strategy is better, and how much better is it? Just because a treatment effect is “significant” doesn’t necessarily mean it’s important or meaningful.
To estimate treatment effects, we use our model to calculate expected “post” values for given “trt” and “baseline” values. For example, expected sales for all treatments assuming a baseline value of 25 can be calculated using the predict() function. (We chose a baseline of 25 since that’s the overall mean of baseline values.)
predict(m, newdata = data.frame(trt = factor(1:3),
                                baseline = 25))
         1        2        3
  39.81741 34.74202 26.84058
The emmeans package (Lenth, 2023) automates calculations such as this and provides facilities for making pairwise comparisons of means with confidence intervals on the difference. Below we specify we want to estimate expected mean sales for each treatment group and make pairwise comparisons of those means using the emmeans() function. We simply give it our model object and use the syntax pairwise ~ trt.
library(emmeans)
emmeans(m, pairwise ~ trt)
  $emmeans
   trt emmean    SE df lower.CL upper.CL
   1     39.8 0.858 11     37.9     41.7
   2     34.7 0.850 11     32.9     36.6
   3     26.8 0.838 11     25.0     28.7

  Confidence level used: 0.95

  $contrasts
   contrast    estimate   SE df t.ratio p.value
   trt1 - trt2     5.08 1.23 11   4.130  0.0044
   trt1 - trt3    12.98 1.21 11  10.764  <.0001
   trt2 - trt3     7.90 1.19 11   6.647  0.0001

  P value adjustment: tukey method for comparing a family of 3 estimates
The expected mean values are in the section called “emmeans”, which is short for estimated marginal means. This is another of way saying we calculated expected values holding one or more predictors fixed. In this case the emmeans packaged held “baseline” fixed at 25, the overall mean baseline value. Notice this section includes confidence intervals on the estimated means. It appears promotional strategy one (trt = 1) leads to sales of about 37 to 41 cases.
The “contrast” section presents the pairwise comparisons. The estimates are the difference in means and the tests are for the null hypothesis that the difference is equal to 0. All differences appear reliably different from 0 based on the small p-values. Notice these are adjusted Tukey p-values which are inflated to account for the fact we’re running three tests instead of one. This helps guard against false positives (i.e., rejecting a null hypothesis in error). The chance of this happening increases when performing multiple comparisons. (See our article, Understanding Multiple Comparisons and Simultaneous Inference, for more information.)
To calculate confidence intervals on the differences in means we can pipe the output of the emmeans() function into confint().
emmeans(m, pairwise ~ trt) |>
  confint()
  $emmeans
   trt emmean    SE df lower.CL upper.CL
   1     39.8 0.858 11     37.9     41.7
   2     34.7 0.850 11     32.9     36.6
   3     26.8 0.838 11     25.0     28.7

  Confidence level used: 0.95

  $contrasts
   contrast    estimate   SE df lower.CL upper.CL
   trt1 - trt2     5.08 1.23 11     1.76     8.39
   trt1 - trt3    12.98 1.21 11     9.72    16.23
   trt2 - trt3     7.90 1.19 11     4.69    11.11

  Confidence level used: 0.95
  Conf-level adjustment: tukey method for comparing a family of 3 estimates
It looks like promotional strategy “trt1” can be expected to sell anywhere from about 1 to 8 more cases than promotional strategy “trt2”. This difference may not be meaningful, especially if the cost of promotional strategy “trt1” is much higher than promotional strategy “trt2”.
So how did we know emmeans was holding “baseline” at 25? We called the ref_grid() function on our model object.
ref_grid(m)
  'emmGrid' object with variables:
      baseline = 25
      trt = 1, 2, 3
This shows what values emmeans will use to calculate expected means. If we want to hold “baseline” at a different value, say 20, we can use the at argument. It requires values be passed to it as a list object.
emmeans(m, pairwise ~ trt,
        at = list(baseline = 20))
  $emmeans
   trt emmean    SE df lower.CL upper.CL
   1     35.3 0.899 11     33.3     37.3
   2     30.2 1.064 11     27.9     32.6
   3     22.3 1.004 11     20.1     24.6

  Confidence level used: 0.95

  $contrasts
   contrast    estimate   SE df t.ratio p.value
   trt1 - trt2     5.08 1.23 11   4.130  0.0044
   trt1 - trt3    12.98 1.21 11  10.764  <.0001
   trt2 - trt3     7.90 1.19 11   6.647  0.0001

  P value adjustment: tukey method for comparing a family of 3 estimates
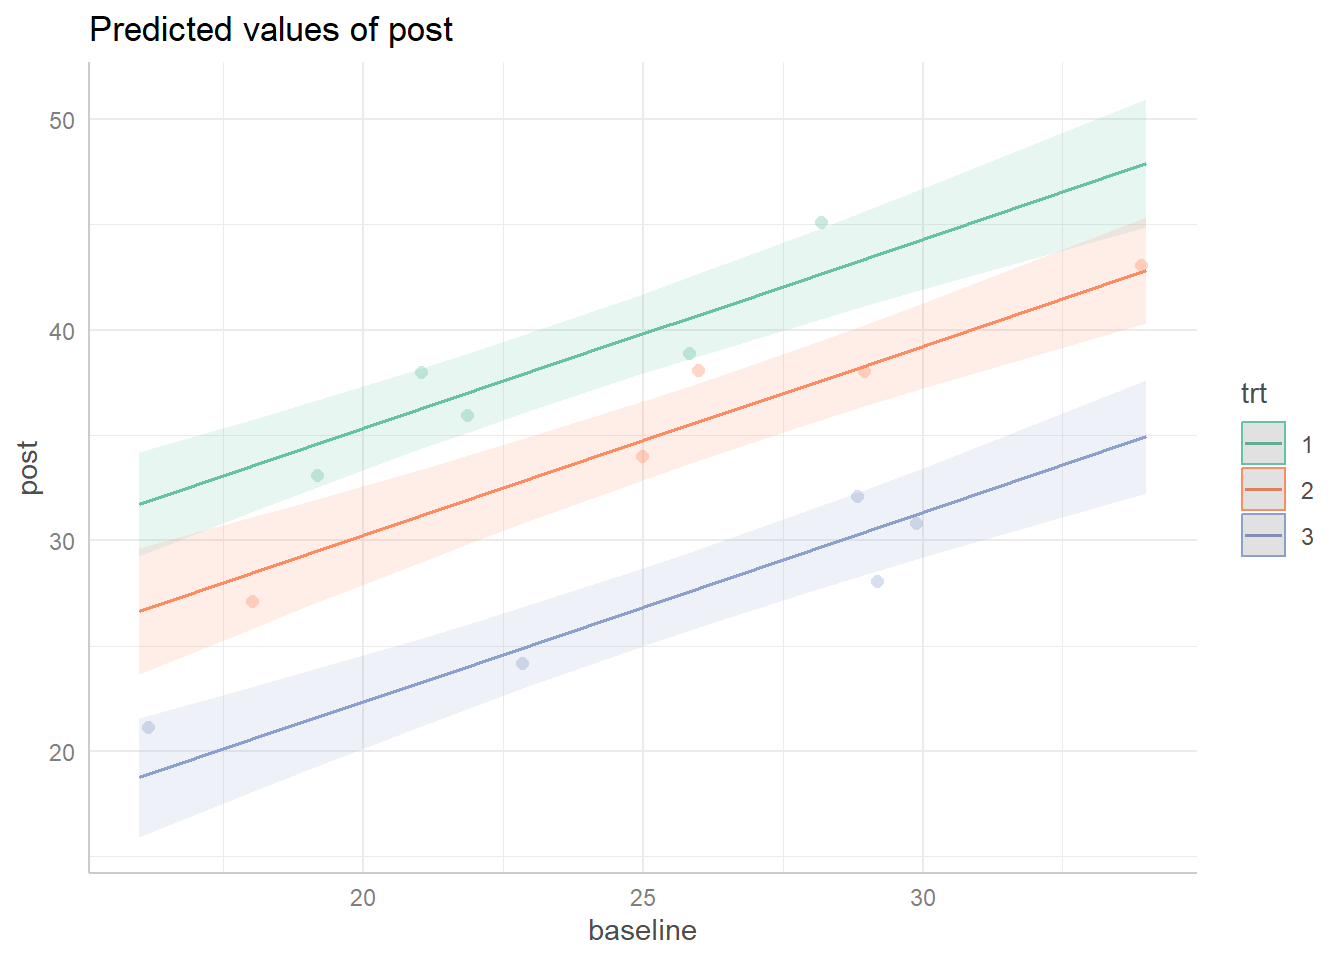
Finally we might wish to visualize our ANCOVA model with an effect display. The ggpredict() function from the ggeffects package (Lüdecke, 2018) along with its plot() method make this easy. Once again we use the “Set2” palette from the RColorBrewer package by setting colors = RColorBrewer::brewer.pal(3, "Set2"). The vertical distance between the slopes reveal that promotions 1 and 2 are likely to generate more sales than promotion 3.
library(ggeffects)
ggpredict(m, terms = c("baseline", "trt")) |>
  plot(add.data = TRUE, colors = RColorBrewer::brewer.pal(3, "Set2"))
It’s worth noting that Kutner et al. define the ANCOVA model a little differently. In their formulation, they use sum contrasts (or deviation coding) for the categorical variables and center the numeric variable. To fully replicate their example we need to change the contrast of “trt” and center “baseline”. Below we use the contr.sum() function to change the contrast definition for the “trt” variable. We set the function argument to 3 since “trt” has three levels. Next we create a centered version of “baseline” by subtracting the mean from all values. Finally we fit the same model. Notice the test for “trt” effect is identical to our original model (F = 59.483, p < 0.00001).
contrasts(d$trt) <- contr.sum(3)
d$baseline_c <- d$baseline - mean(d$baseline)
m3 <- lm(post ~ baseline_c + trt, data = d)
anova(m3)
  Analysis of Variance Table

  Response: post
             Df Sum Sq Mean Sq F value    Pr(>F)
  baseline_c  1 190.68 190.678  54.379 1.405e-05 ***
  trt         2 417.15 208.575  59.483 1.264e-06 ***
  Residuals  11  38.57   3.506
  ---
  Signif. codes:  0 '***' 0.001 '**' 0.01 '*' 0.05 '.' 0.1 ' ' 1
The estimated means and contrasts are identical as well.
emmeans(m3, pairwise ~ trt)
  $emmeans
   trt emmean    SE df lower.CL upper.CL
   1     39.8 0.858 11     37.9     41.7
   2     34.7 0.850 11     32.9     36.6
   3     26.8 0.838 11     25.0     28.7

  Confidence level used: 0.95

  $contrasts
   contrast    estimate   SE df t.ratio p.value
   trt1 - trt2     5.08 1.23 11   4.130  0.0044
   trt1 - trt3    12.98 1.21 11  10.764  <.0001
   trt2 - trt3     7.90 1.19 11   6.647  0.0001

  P value adjustment: tukey method for comparing a family of 3 estimates
Interested readers may also wish to verify the effect display is no different, other than “baseline” being centered at 0.
So how is this new model different from the first one we fit? The changes can be seen by comparing the model coefficients. Below we use the coef() function to extract the model coefficients and then wrap them in a named list to help us identify which coefficients go with which model.
list(`treatment contrast; uncentered` = coef(m),
     `sum contrast; centered` = coef(m3))
  $`treatment contrast; uncentered`
  (Intercept)    baseline        trt2        trt3
   17.3534214   0.8985594  -5.0753902 -12.9768307

  $`sum contrast; centered`
  (Intercept)  baseline_c        trt1        trt2
   33.8000000   0.8985594   6.0174070   0.9420168
The coefficients in the first section are from a model using treatment contrasts and an uncentered “baseline”. The (Intercept) is the estimated mean sales of “trt1” when baseline = 0. This is probably not meaningful since it’s doubtful a product would have sales of 0 in the previous observation period. The coefficients for “trt2” and “trt3” are the expected differences from “trt1” sales assuming baseline = 0. Hence the name “treatment contrast”. In this case since “trt” and “baseline” do not interact, these coefficients are interpretable. In fact these are the contrasts estimated by emmeans (with a change in sign since the order of subtraction is reversed). The coefficient for “baseline”, 0.89, is almost 1, suggesting a one-to-one correspondence between “baseline” and “post”. That is, a one-unit increase in “baseline” sales leads to about a one-unit increase in “post” sales, all else held constant.
The coefficients in the second section are from a model using sum contrasts and a centered “baseline”. The (Intercept) is the estimated mean of the “trt” means when “baseline_c” = 0. This comes out to 33.8. Since “baseline_c” = 0 is the mean value of baseline, the (Intercept) is interpretable. The coefficients for “trt1” and “trt2” are the expected differences between the means of those groups and the mean of the “trt” means, assuming baseline is held at the mean level. The “baseline_c” coefficient is the only similarity to the previous model, since centering a variable does not change its estimated coefficient in additive models such as these. This all may be a bit confusing, so let’s show this using predicted means.
Below we use model “m3” to calculate expected means at all treatment levels assuming “baseline_c” is set to 0.
pm <- predict(m3, newdata = data.frame(trt = factor(1:3),
                                 baseline_c = 0))
pm
         1        2        3
  39.81741 34.74202 26.84058
The mean of those means is the intercept in model “m3”.
mean(pm)
[1] 33.8
And subtracting the mean of the means from the model predicted means of trt1 and trt2 give us the “trt” coefficients.
pm[1] - mean(pm)
         1
  6.017407
pm[2] - mean(pm)
          2
  0.9420168
Notice in a sum contrast the final level is never compared to the other levels. For more information on sum contrasts and other types of coding schemes we recommend the article R Library Contrast Coding Systems for categorical variables.
Since a model with sum contrasts is not making simple comparisons between group means, we should technically not use the Tukey adjustment when making multiple comparisons. The Tukey procedure is only appropriate when directly comparing group means. With a sum contrast we are comparing group means to a mean of group means, a subtle distinction. A general procedure for any type of contrasts involving group means is the Scheffe Multiple Comparison procedure. This is the approach presented in Kutner et al. Fortunately this is easy to implement using emmeans. Simply add the argument adjust = "scheffe". Notice that although the estimates are the same, the confidence intervals are slightly wider.
emmeans(m, pairwise ~ trt) |>
  confint(adjust = "scheffe")
  $emmeans
   trt emmean    SE df lower.CL upper.CL
   1     39.8 0.858 11     37.0     42.6
   2     34.7 0.850 11     32.0     37.5
   3     26.8 0.838 11     24.1     29.6

  Confidence level used: 0.95
  Conf-level adjustment: scheffe method with rank 3

  $contrasts
   contrast    estimate   SE df lower.CL upper.CL
   trt1 - trt2     5.08 1.23 11     1.61     8.54
   trt1 - trt3    12.98 1.21 11     9.57    16.38
   trt2 - trt3     7.90 1.19 11     4.55    11.26

  Confidence level used: 0.95
  Conf-level adjustment: scheffe method with rank 2
The choice of contrast and whether or not to center predictors is subjective. Unless you have a good reason to switch, we recommend sticking with treatment contrasts. These are the default contrasts in R, Stata, SAS, and SPSS. Centering predictors makes intercepts interpretable in models without non-linear effects and can sometimes help with convergence issues in complex models. But when it comes to post-hoc analyses such as making pairwise comparisons between group means, it doesn’t matter whether your numeric data is centered or not.
Why not use differences?
Instead of ANCOVA, wouldn’t it be easier to just take the difference between the follow-up measure and baseline measure and analyze the change in sales using a one-way Analysis of Variance (ANOVA)? Let’s try that. Below we derive a new variable, “diff”, by subtracting “baseline” from “post”, and then model “diff” as a function of “trt”.
d$diff <- d$post - d$baseline
aout <- lm(diff ~ trt, data = d)
anova(aout)
  Analysis of Variance Table

  Response: diff
            Df Sum Sq Mean Sq F value    Pr(>F)
  trt        2  440.4   220.2  62.914 4.356e-07 ***
  Residuals 12   42.0     3.5
  ---
  Signif. codes:  0 '***' 0.001 '**' 0.01 '*' 0.05 '.' 0.1 ' ' 1
It seems like “trt” explains a lot of variability in the mean differences.
Let’s estimate treatment effects for the differences and make pairwise comparisons.
emmeans(aout, pairwise ~ trt)
  $emmeans
   trt emmean    SE df lower.CL upper.CL
   1     15.0 0.837 12  13.1771    16.82
   2      9.6 0.837 12   7.7771    11.42
   3      1.8 0.837 12  -0.0229     3.62

  Confidence level used: 0.95

  $contrasts
   contrast    estimate   SE df t.ratio p.value
   trt1 - trt2      5.4 1.18 12   4.564  0.0017
   trt1 - trt3     13.2 1.18 12  11.156  <.0001
   trt2 - trt3      7.8 1.18 12   6.592  0.0001

  P value adjustment: tukey method for comparing a family of 3 estimates
The “emmeans” section presents estimated mean differences and the “contrasts” section presents pairwise comparisons of those differences. The results in the “contrasts” section are actually not much different than what we obtained using the ANCOVA model. It turns out that if the slope on the baseline covariate is close to 1, then ANCOVA and ANOVA are basically the same. Recall above that the slope coefficient for “baseline” was 0.89, which is close to 1.
However, using change as a dependent variable can be problematic, especially if the baseline measure is used to exclude subjects from your study. For example, if subjects need to have a baseline measure higher than some threshold to be included in your study, then there’s good a chance that any change from baseline will be due to regression to the mean rather than the experimental condition. In his article, Statistical Errors in the Medical Literature, Frank Harrell lists other reasons why using “change from baseline” as a dependent variable can lead to problems. Long story short, using change from baseline requires a number of additional assumptions to be met that ANCOVA does not require.
Power and sample size considerations
ANCOVA is often used to analyze experimental data, just like the example we presented above. When it comes to designing an experiment, one of the key questions to consider is, “how much data do we need?” Experiments often cost a lot of money and/or require invasive procedures involving humans or animals. It’s in everyone’s best interest to collect just enough data to reliably answer our research question. Estimating sample sizes for ANCOVA models can be a little challenging. Fortunately, the Superpower package in R (Lakens and Caldwell, 2021) provides the power_oneway_ancova() function to help guide us.
Let’s imagine we’re designing an experiment to assess which of three different training programs best improve the length of time someone can hang from a pull-up bar. Before we begin the experiment, we’ll measure everyone’s baseline time of how long they can hang before exhaustion. We’ll then randomize participants to one of the three training programs, have them follow the program, and then measure how long they can hang at the end of the training program. How many subjects should we recruit?
To analyze this using the power_oneway_ancova() function, we need to hypothesize some quantities:
- the hypothesized mean follow-up hang times in the three groups:
mu - the number of covariates (i.e., numeric predictors in our model):
n_cov - the estimated squared correlation between baseline and follow-up measures:
r2 - the estimated residual standard error:
sd - the significance level at which we’ll reject the null hypothesis of no treatment effect:
alpha_level - the Type II error we’re willing to accept:
beta_level
Perhaps we think the mean follow-up hang times for the three training programs will be something like 30 seconds, 40 seconds, and 50 seconds. So we set mu = c(30, 40, 50). Next we will only use one covariate, the baseline measure, so we set n_cov = 1. We hypothesize that baseline and follow-up hang times will have a mild positive correlation of about 0.3, so we set r2 = 0.3^2. (“r2”, or R-squared, is correlation squared.) We imagine our ANCOVA model will have a residual standard error of about 15 seconds, so we set sd = 15. (This is basically how precise we think our model will be; e.g., estimated mean plus/minus 15 seconds.) Our significance level to reject the null hypothesis of no treatment effect will be 0.05, so we enter alpha_level = 0.05. Finally we want to have 0.9 probability (i.e., power) of correctly rejecting the null assuming the null truly is false, so we set our desired Type II error to 1 - 0.9: beta_level = 0.10.
library(Superpower)
power_oneway_ancova(mu = c(30, 40, 50),
                    n_cov = 1,
                    r2 = 0.3^2,
                    sd = 15,
                    alpha_level = 0.05,
                    beta_level = 0.10)
       Power Calculation for 1-way ANCOVA

              dfs = 2, 41
                N = 45
                n = 15, 15, 15
            n_cov = 1
               mu = 30, 40, 50
               sd = 15
               r2 = 0.09
      alpha_level = 0.05
       beta_level = 0.08629895
            power = 91.37011
             type = exact
The result says we need about 45 subjects, or 15 in each group, if our hypothesized means, R-squared, and residual standard error are correct. How do we know if they’re correct? We don’t. We just have to do our best to estimate realistic and important values, perhaps using previous studies or pilot data. For more details on power and sample size analysis of ANCOVA models see Shieh (2020) and the vignettes that accompany the Superpower package.
Hopefully you now have a better understanding of how to plan, execute, and interpret an ANCOVA model.
R session details
The analysis was done using the R Statistical language (v4.5.1; R Core Team, 2025) on Windows 11 x64, using the packages Superpower (v0.2.4), emmeans (v1.11.2), ggeffects (v2.3.0) and ggplot2 (v3.5.2).
References
- Fox J, Weisberg S (2019). An R Companion to Applied Regression, Third edition. Sage, Thousand Oaks CA. https://socialsciences.mcmaster.ca/jfox/Books/Companion/.
- Harrell F (2017). Statistical Errors in the Medical Literature. (n.d.). https://www.fharrell.com/post/errmed/ (accessed April 14, 2023).
- Kutner et al (2005). Applied Linear Statistical Models. McGraw-Hill. (Chapter 22)
- Neuwirth E (2022). RColorBrewer: ColorBrewer Palettes. https://CRAN.R-project.org/package=RColorBrewer.
- Lakens D & Caldwell AR. (2021). Simulation-Based Power Analysis for Factorial Analysis of Variance Designs. Advances in Methods and Practices in Psychological Science, 4(1), 251524592095150. https://doi.org/10.1177/2515245920951503
- Lenth R (2023). emmeans: Estimated Marginal Means, aka Least-Squares Means. R package version 1.8.5, https://CRAN.R-project.org/package=emmeans.
- Lüdecke D (2018). “ggeffects: Tidy Data Frames of Marginal Effects from Regression Models.” Journal of Open Source Software, 3(26), 772. doi:10.21105/joss.00772 https://doi.org/10.21105/joss.00772.
- R Library Contrast Coding Systems for categorical variables. UCLA: Statistical Consulting Group. from https://stats.oarc.ucla.edu/r/library/r-library-contrast-coding-systems-for-categorical-variables/ (accessed April 17, 2023)
- R Core Team (2023). R: A language and environment for statistical computing. R Foundation for Statistical Computing, Vienna, Austria. URL https://www.R-project.org/.
- Shieh G. (2020). Power analysis and sample size planning in ANCOVA designs. Psychometrika, 85(1), 101-120
- Wickham H. ggplot2: Elegant Graphics for Data Analysis. Springer-Verlag New York, 2016.
Clay Ford
Statistical Research Consultant
University of Virginia Library
April 17, 2023
For questions or clarifications regarding this article, contact statlab@virginia.edu.
View the entire collection of UVA Library StatLab articles, or learn how to cite.