
One of the assumptions of the Analysis of Variance (ANOVA) is constant variance. That is, the spread of residuals is roughly equal per treatment level. A common way to assess this assumption is plotting residuals versus fitted values. Recall that residuals are the observed values of your response of interest minus the predicted values of your response. In a one-way ANOVA, this is simply the observed values minus the group mean. For example, below we have a plot of residuals versus fitted values for a one-way ANOVA. The first treatment group has a mean of about 7. The dots in the group on the far left represent the difference between the observed value minus the mean.
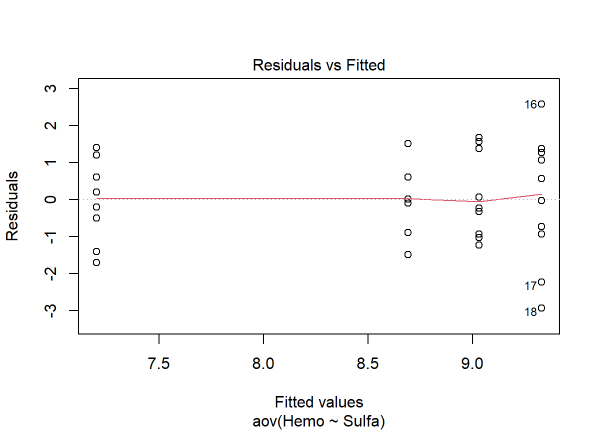
An important feature of this graph is the spread of the dots. The assumption of constant variance implies the scatter of these dots should be roughly equal for each group. The group on the far right has more scatter than the other three groups. Is this cause for concern?
Dean and Voss (1999, page 112) suggest a rule of thumb to answer this question: If the ratio of the largest treatment variance estimate to the smallest treatment variance estimate does not exceed 3, \(s^{2}_{max}/s^{2}_{min} < 3\), the assumption is probably satisfied. Let’s try this rule of thumb with some data from Dean and Voss’s book. In exercise 15 of chapter 3, they present data on trout as follows:
“The data show the measurements of hemoglobin (grams per 100 ml) in the blood of brown trout. The trout were placed at random in four different troughs. The fish food added to the troughs contained, respectively, 0, 5, 10, and 15 grams of sulfamerazine (an antibacterial agent) per 100 pounds of fish (coded 1, 2, 3, 4). The measurements were made on ten randomly selected fish from each trough after 35 days. (Gutsell, 1951, Biometrics)”
All data in the Dean and Voss text book are available here. Below we use R to read in the data, prepare it, and perform a one-way ANOVA:
trout <- read.table("http://deanvossdraguljic.ietsandbox.net/DeanVossDraguljic/R-data/trout.txt", header=TRUE)
trout$Sulfa <- factor(trout$Sulfa)
aov1  <- aov(Hemo ~ Sulfa, data=trout)
summary(aov1)
            Df Sum Sq Mean Sq F value  Pr(>F)
Sulfa        3  26.80   8.934   5.696 0.00268 **
Residuals   36  56.47   1.569
---
Signif. codes:  0 '***' 0.001 '**' 0.01 '*' 0.05 '.' 0.1 ' ' 1
The low p-value provides strong evidence that the mean level of hemoglobin differs between the sulfamerazine groups. We can easily calculate the group means with the aggregate function:
aggregate(Hemo ~ Sulfa, data=trout, mean)
  Sulfa Hemo
1     1 7.20
2     2 9.33
3     3 9.03
4     4 8.69
The fish who received no sulfamerazine have a mean hemoglobin level of 7.2 versus about 9 for the other groups. The ANOVA test says provides evidence against the null hypothesis of no difference between the four group means.
Now the F-test that the ANOVA analysis carries out assumes there is equal variance among residuals for each sulfamerazine group. The graph above is the visual assessment for this particular analysis. We obtained it with the following R code:
plot(aov1, which = 1) # returns the plot above
As we noted earlier, the group on the far right (with the largest mean) has more scatter than the other groups. What does our rule of thumb tell us?
tvars <- with(trout, tapply(Hemo,Sulfa,var))
max(tvars)/min(tvars)
[1] 2.943834
The tapply function says, “Take the Hemo values, group them according to their Sulfa value, and calculate the variance for each group.” The max() and min() functions find the maximum and minimum values of the variances stored in the tvars vector. The ratio is just under 3. We can probably rest easy, but we may want to keep that in mind for future experiments. The sulfamerazine level of 15 grams may affect some fish more than others and cause increased variability in hemoglobin levels.
So where does this rule of thumb come from anyway? According to Dean and Voss, it’s suggested by simulation studies in which the true variances are specified (p. 113). We can attempt to replicate some of these simulation studies using R. First we create a function called evROT() (for “equal variance Rule of Thumb”) to calculate the ratio of the smallest and largest variances:
evROT <- function(resp, trt){
  tvars <- tapply(resp,trt,var)
  max(tvars)/min(tvars)
 }
Now we can “replicate” that function many times using simulated data as follows:
n <- 10
groups <- gl(n = 4, k = n)
sims <- replicate(n=10000,
          expr = evROT(rnorm(4*n, mean = rep(1:4,each=n), sd = 1), groups))
How the simulation works:
n <- 10defines how many observations we have in each group.- The
gl()function generates a vector consisting of n each of 4 levels. - The
replicate()function replicates the expression defined in expr 10,000 times. - The
rnorm()function generates 4*n observations with means of 1, 2, 3, and 4 for each group of n. Notice that sd = 1. This means all group variances are the same.
Once we run the simulation, we calculate the proportion of times the ratio exceeds 3:
mean(sims > 3)
[1] 0.3867
In 10,000 simulations with n = 10, we exceeded 3 almost 40% of the time! Maybe this rule of thumb isn’t as good as advertised. But when we increase n from 10 to 25 the ratio exceeds 3 just 4% of the time. So sample size clearly plays a role in how much faith we place in this rule of thumb. Perhaps that’s why others recommend a ratio of 1.5 instead of 3. Either way, remember it’s just a rule of thumb, not a statistical fact. Use it along with residual plots and subject expertise to assess the constant variance assumption of your ANOVA analysis.
R session details
Analyses were conducted using the R Statistical language (version 4.5.1; R Core Team, 2025) on Windows 11 x64 (build 26100)
References
- Dean A and Voss D (1999). Design and Analysis of Experiments, 1st edition. Springer.
- R Core Team (2023). R: A Language and Environment for Statistical Computing. R Foundation for Statistical Computing, Vienna, Austria. https://www.R-project.org/.
Clay Ford
Statistical Research Consultant
University of Virginia Library
July 29, 2014
For questions or clarifications regarding this article, contact statlab@virginia.edu.
View the entire collection of UVA Library StatLab articles, or learn how to cite.