
Introduction
In the last post, we began exploring the comments submitted to the Ours to Shape website. We looked at the distribution across categories and contributors, the length and readability of the comments, and a few key words in context. While I did more exploration of the data than reported, the first post gives a taste of the kind of dive into the data that usefully proceeds analysis.
In this post, we’ll start digging into word frequencies, relative frequencies by groups, and distinguishing words.
Once gain, I’m going to focus on results rather than code. The full code to recreate the analysis in the blog posts is available on GitHub. If you’re new to quanteda and would like to know more, check out our new StatLab article (by Leah Malkovich) on getting started with quanteda!
Word Frequency
From the corpus of comments, I create a document-feature matrix (or dfm). The dfm captures the number of times each word in the corpus appears within each comment. A document-feature matrix tends to be large – n documents by thousands of words – and sparse – with many words not appearing in many documents. So I begin by reducing the dimensionality of the matrix a bit: changing everything to lowercase (so “Library” and “library” are treated as the same word), removing punctuation, and removing a set of stop words (words that are commonly used but carry little substantive content, e.g., the, of, that, etc.).
Document-feature matrix of: 848 documents, 7,812 features (99.4% sparse).
This leaves us with 7,812 words (features). The ten most frequently occurring words are…
       uva   students  community university        can    faculty
       829        801        589        511        440        300
       one       make    student    grounds
       203        201        198        193
And, for the word cloud lovers out there (you know who you are), here’s a cloud of the 200 most frequent words in the comments.
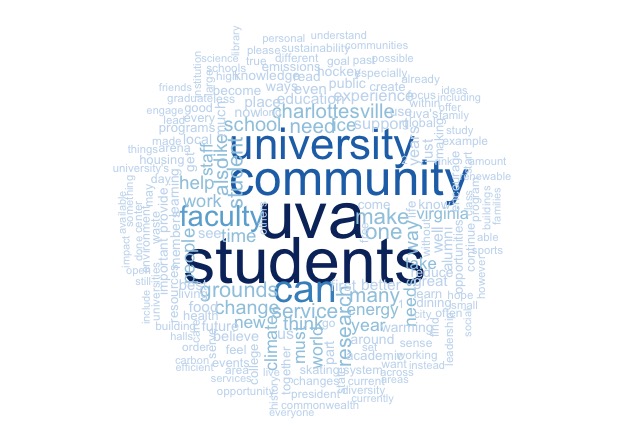
I have a hard time reading clouds (it’s a bunny! no, a rabid zombie bunny!), so here’s a frequency plot of the 50 most common words (less prone to wild and imaginative interpretations).
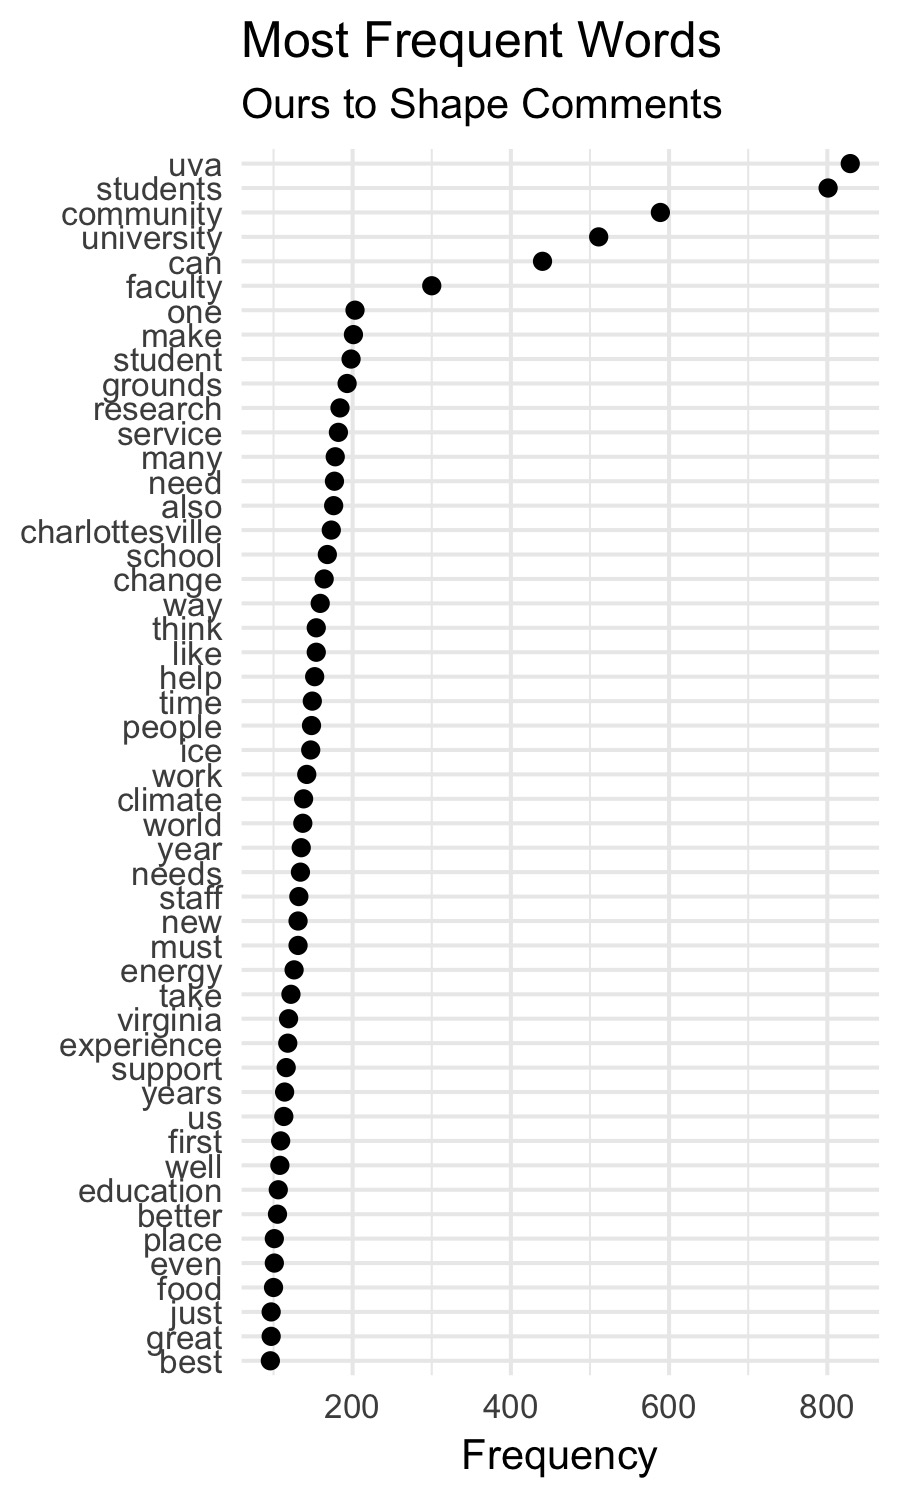
UVA and students appear A LOT more frequently than anything else. But we also get plenty of mentions of research and service, Charlottesville and change, ice (we’ll come back to that), experience and support. Good stuff.
Things begin to pop more clearly when we break this down by comment category. That starts to address one of the questions I have about these contributions – what do folks mean by “community, discovery, service”?
Here we see the relative frequency – how often a word occurs as a proportion of all occurring words – by the category of the comment:
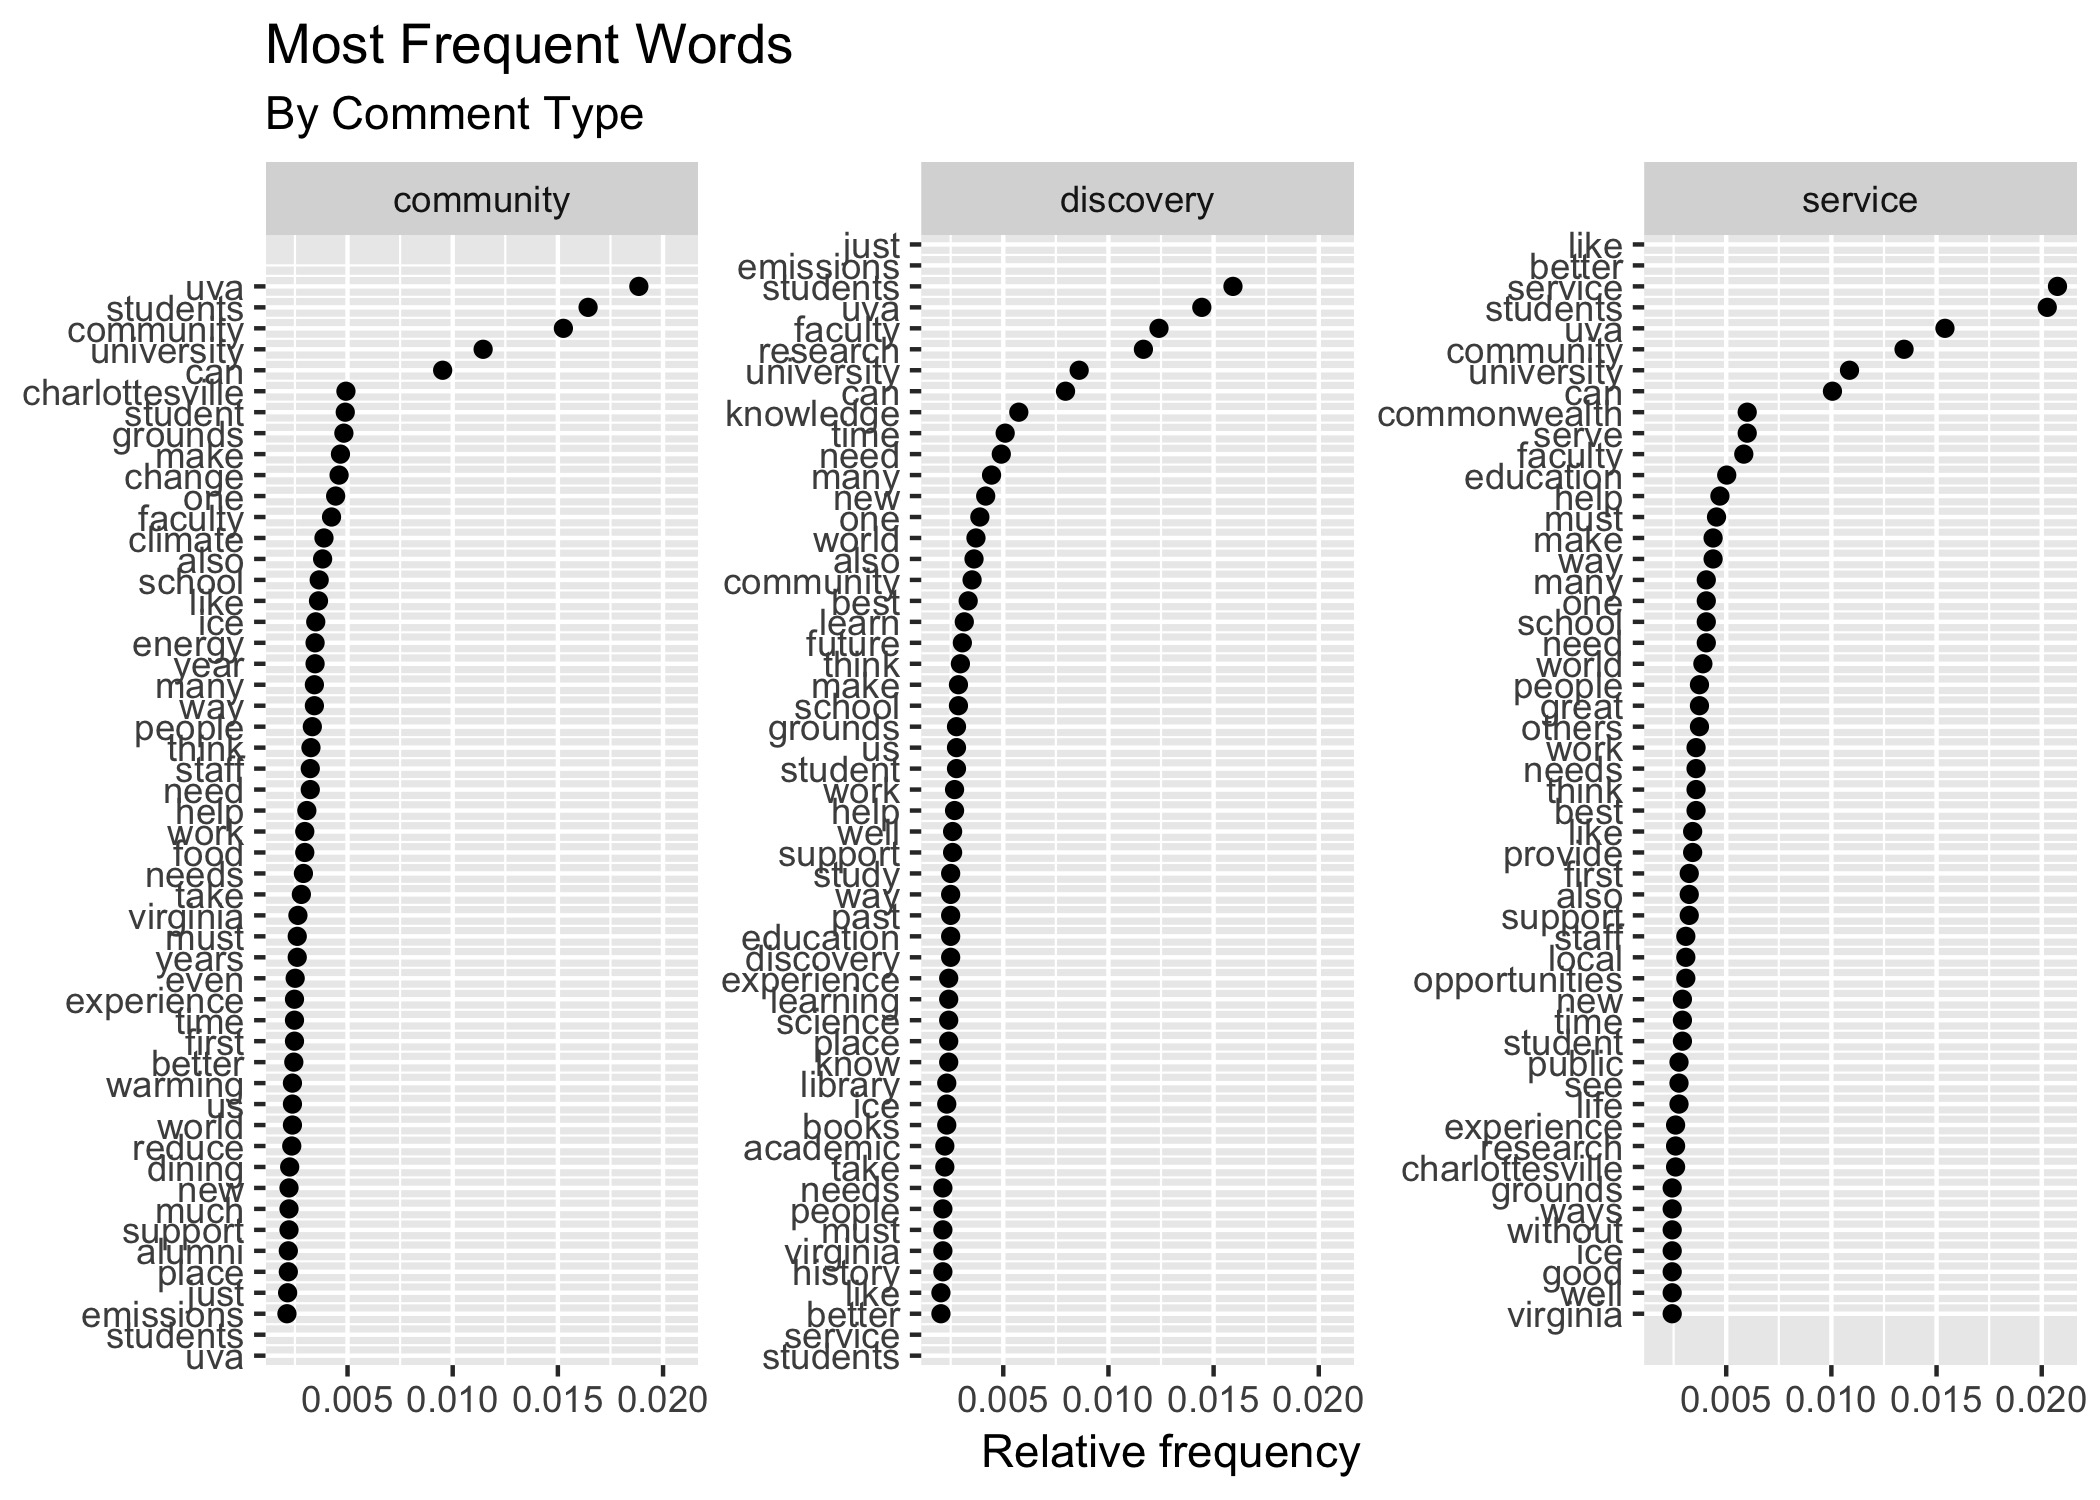
The most frequently appearing words in comments submitted about community are UVA, students, community, and university (and can); Charlottesville comes next, but with a notable drop off in frequency. Students and grounds follow closely behind (note the “student” and “students” – here’s an example of why we might want to stem the words later, that is, reduce them to their root form so that these are counted together). I admit I was disappointed about this; it implies that a lot of contributions about “community” are referencing the “university community” when I was hoping they were about the university’s engagement with its neighbors in the larger Charlottesville region. That broader meaning of community is represented in the comments – it’s just not obviously dominant.
What about discovery? The top words here also begin with students and UVA, followed by faculty, research, and university (and can).This fits in with the research and knowledge production implied by discovery. [FN: For the moment, ignore the two empty rows at the top and bottom of each panel – the non-plotted words at the top of the middle panel are the last two words in the top 50 for the first panel; the non-plotted words at the bottom of the middle panel are the first two words in the top 50 of the third panel. I need to look further into what quirky little bit caused them to wrap around like that, but am going to ignore them right now.]
The comments contributed under service most frequently use the words service, UVA, community, and university (and can), before moving to Commonwealth, serve, and faculty. We start to get a feel for one of the challenges of comparing word frequencies by this point – there’s not a great deal of differentiation between the groups. Many of the most common words are common across categories.
So let’s ask the question a different way: what words are distinctly associated with each category?
Distinguishing Words
To detect words that distinguish between the comment categories, we'll start with a comparison word cloud.
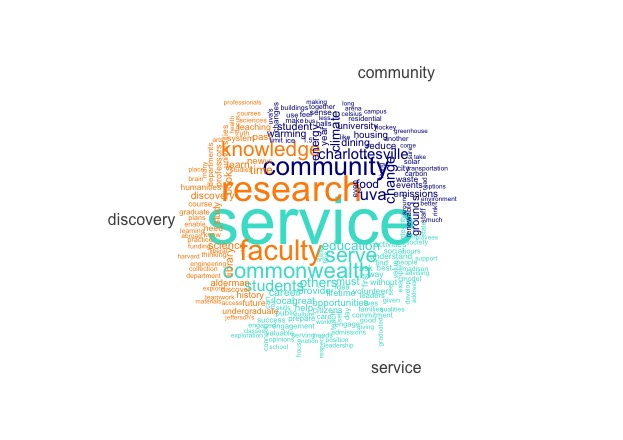
This plots the the 70 words most distinctively associated with each of the three comment types. More specifically, it compares the rate of occurrence of word i in one category of comments (\(p_i\)) to the average rate of occurrence of word i across all categories of comments (\(p_{ic}\)) and plots the words with the maximum positive difference:
$$(p_{ic} − p_i)$$
In the comparison cloud above, we can see that the word service appears much more frequently in the service comments than in the comments overall; research occurs more frequently in discovery comments than in comments overall; and community occurs more in community comments than in the comments overall. That’s not terribly interesting – the word defining the category (or a synonym, in the case of discovery) are the most distinguishing words for each group.
But we can see a few other things as well. Commonwealth and students are more associated with service (given students was one of the most common words in each category, this is helpful). Faculty and knowledge are more associated with discovery. Charlottesville and change are more associated with community – along with some issue-oriented words like climate, food, housing, energy. Perhaps we’re starting to see some of the larger community issues I was hoping to find earlier.
I still find clouds hard to read, so let’s look at this another way, with a measure of the “keyness” of words in each group.
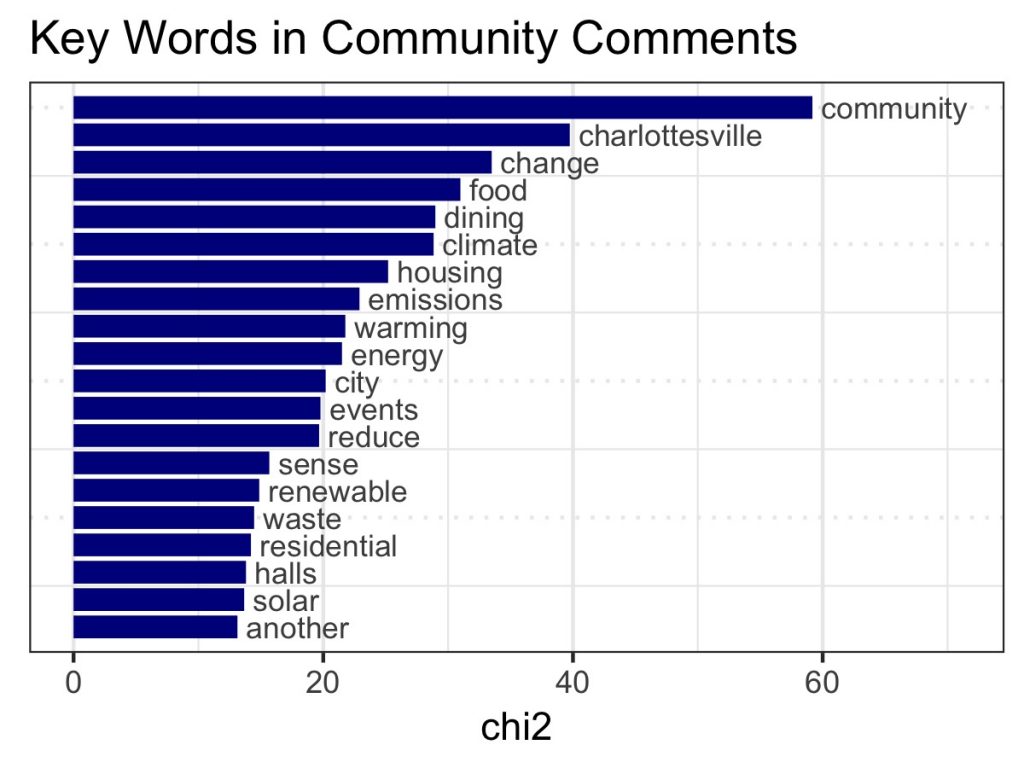
Keyness, in a statistical sense, compares the differential associations of keywords in a target and reference group, identifying words which appear significantly more frequently in a sample than would be expected given their overall frequency in the corpus. The measure here is a classic \(\chi^2\) test based on a 2X2 table of frequencies – the frequency of the word in the target group, in the reference group (everything else), and the frequency of all other words in the target group and in the reference group (Dunning’s likelihood ratio test or point-wise mutual information could be used as well).
In this first figure, the focus is on words that are associated with community comments. Again we see community, Charlottesville, change, and words that evoke larger issues – food, climate, housing, emissions, warming, energy, and the like (I’m guessing dining is an internally-focused issue). These more distinctive words suggest a promising engagement with bigger social challenges. Let’s look at keyness for service:
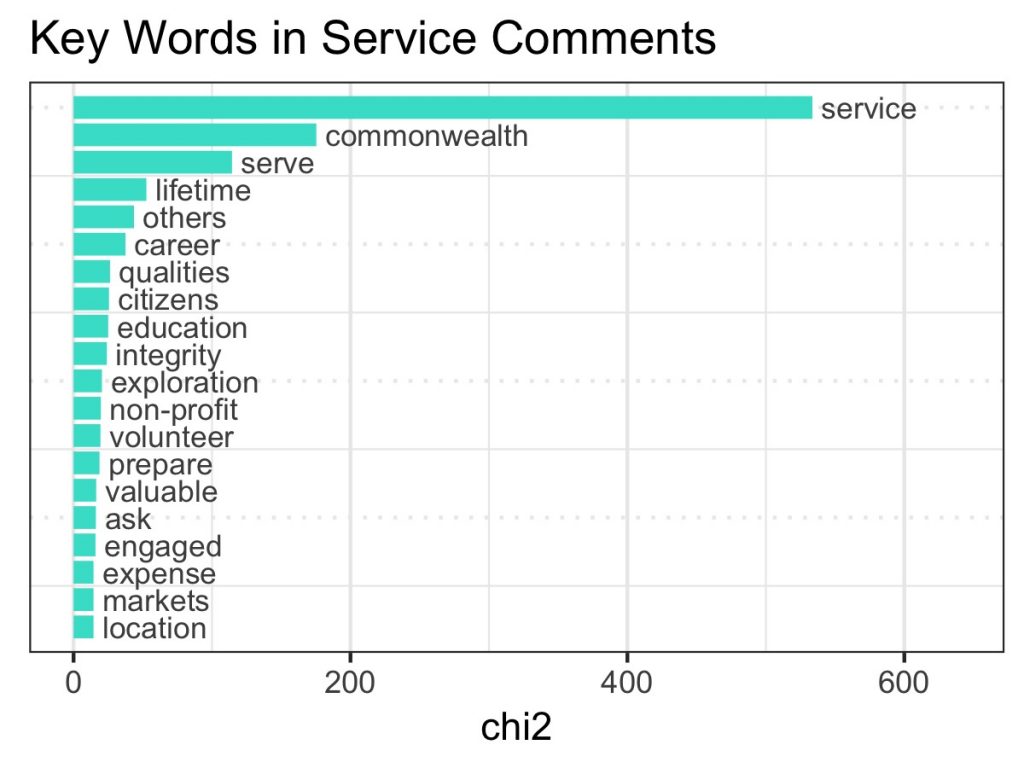
After service/serve, and Commonwealth, there are words that suggest an ethic of engagement – lifelong, others, career, education, integrity, volunteer. Taken as a whole, these comments may revolve around educating an informed an active citizenry.
We might as well finish this out and look at discovery!
These words strike me as “academic” language – research and knowledge, books, humanities and science (never the social sciences, sigh…), study, teach, and learn.
There are other ways of identifying distinguishing words – term frequency-inverse document frequency (tf-idf) being a popular choice. The tf-idf discounts term frequency for words that are common across all documents (or groups), specifically: $$ tf idf = tf_{t,d} \times ln\frac{n_{docs}}{n_{docs,t}}$$
In words, this is the term frequency (tf, frequency of term t in document d) times the natural log of the number of documents over the number of documents that contain term t. Values will be higher when the term appears frequently in a document (or group, in our case) but infrequently across all documents (or groups). If a term appears in all documents, the last ratio will be 1/1, and the idf will be zero (the log of 1), generating a tf-idf score of 0 as well.
We’ll use tf-idf to look at words associated with comments based on a contributor’s primary connection.
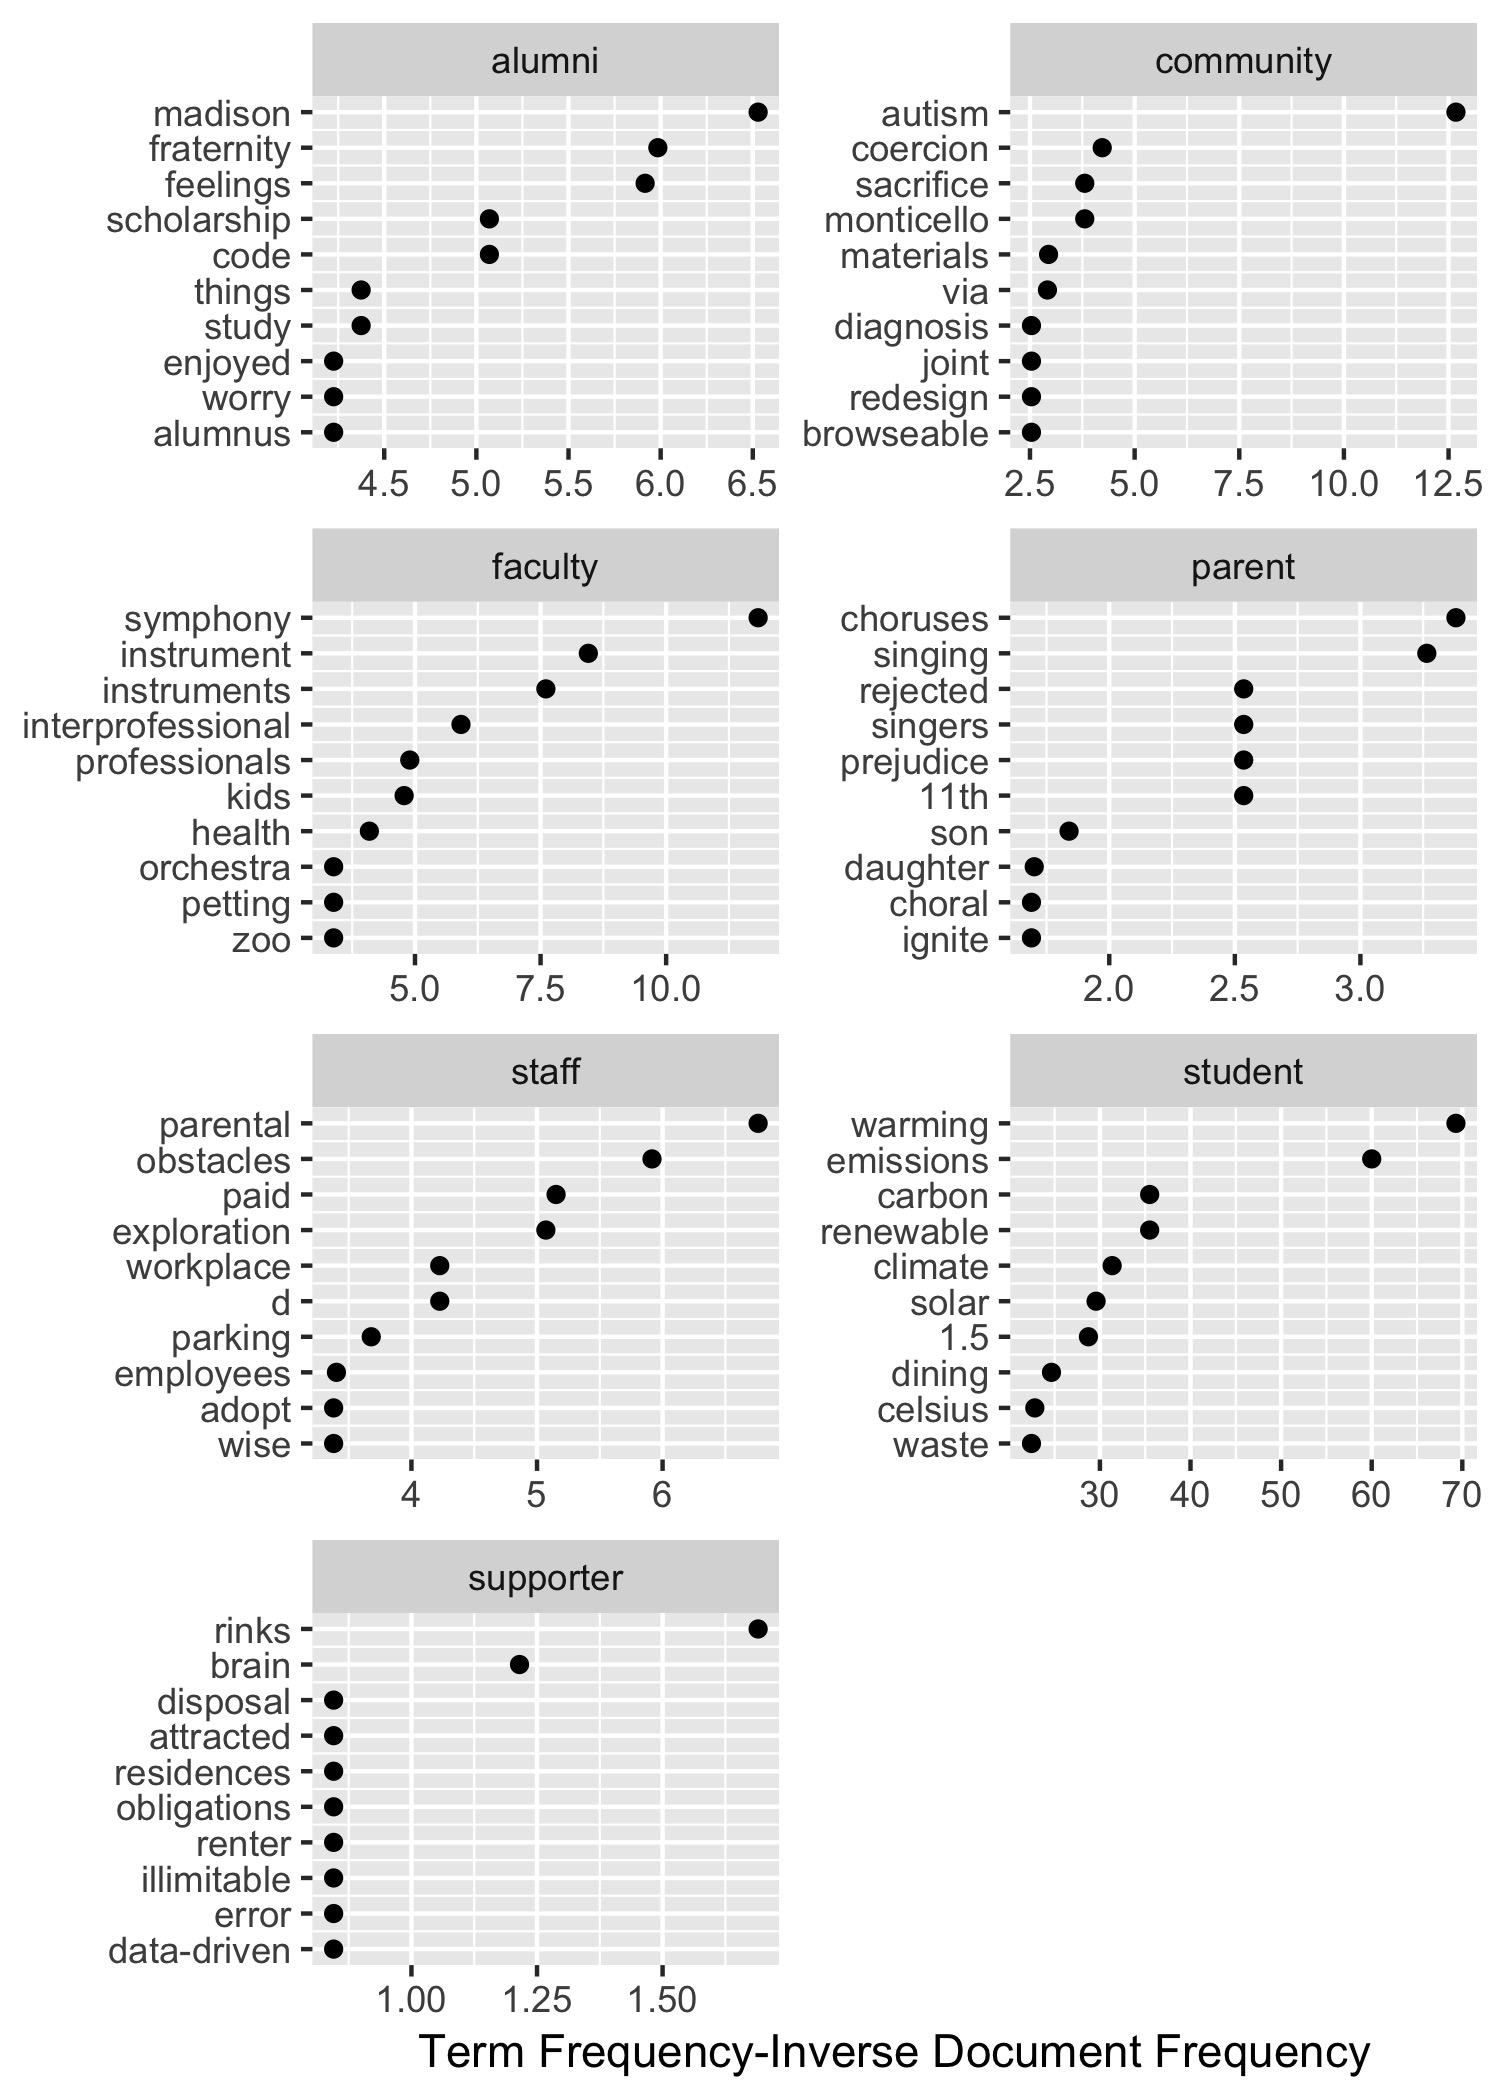
Keep in mind that in this corpus, contributors with a primary connection of supporter, or parent, or community are relatively few – I printed the table of primary connections out again to keep that at the forefront.
   alumni community   faculty    parent     staff   student supporter
      312        44       110        39       172       163         8
With that caveat in mind, what stands out are the high tf-idf words among comments contributed by students – here’s where much of the environmental/sustainability language pops out. References to parental and workplace issues are more associated with comments by staff, while attention to Madison (I’m assuming Madison House) and fraternity are more specific to alumni.
This needs more digging, but a few intriguing differences are suggested by this measure of keywords by contributor.
Up Next
In the next post, I plan on looking at ngrams, feature co-occurrence, and document similarity (there are, it turns out, a number of repeated comments!). And then some sentiment analysis, document clustering, and topic modeling… phew.
Michele Claibourn
Director, Research Data Services
University of Virginia Library
December 14, 2018
For questions or clarifications regarding this article, contact statlab@virginia.edu.
View the entire collection of UVA Library StatLab articles, or learn how to cite.